The Real Price of Social Media Advertising: A Cost Guide for Advertisers

Social media advertising costs now account for nearly 40% of total global digital ad spend. Yet, "how much do ads cost on social media?" remains one of the most searched questions in marketing.
That's because there's not one single sure-shot answer. What you pay depends on your platform, your industry, your campaign objective, and how competitive your target audience is.
A dental practice generating local leads on Facebook, a D2C skincare brand scaling on TikTok, and a SaaS company running LinkedIn lead gen are all running social ads.
This article maps out exactly what drives the cost of social media advertising, platform by platform and vertical by vertical, so you can plan with real numbers instead of industry rumors.
Whether you are setting a budget for the first time or checking if your current spend aligns with the average cost of social media advertising in your category, this guide gives you a working benchmark.
Key Numbers Every Social Media Advertiser Should Know
How Ad Auctions Work and What You Actually Pay
To make informed decisions, you need to understand how ad action works.
Paid vs. Organic: The Fundamental Difference
Organic content relies on a platform’s algorithm to reach your existing followers. Paid social allows you to bypass the algorithm and target precisely defined audiences beyond that base through real-time, competitive auctions.
How the Auction Decides Your Cost
Every time a user opens a feed, an auction fires in milliseconds.
Meta holds roughly 38% of global social ad revenue, and the winning ad in its auction is not the one with the highest bid.
It's the one with the highest Total Value score, calculated as:
Total Value = (Advertiser Bid × Estimated Action Rate) + Ad Quality
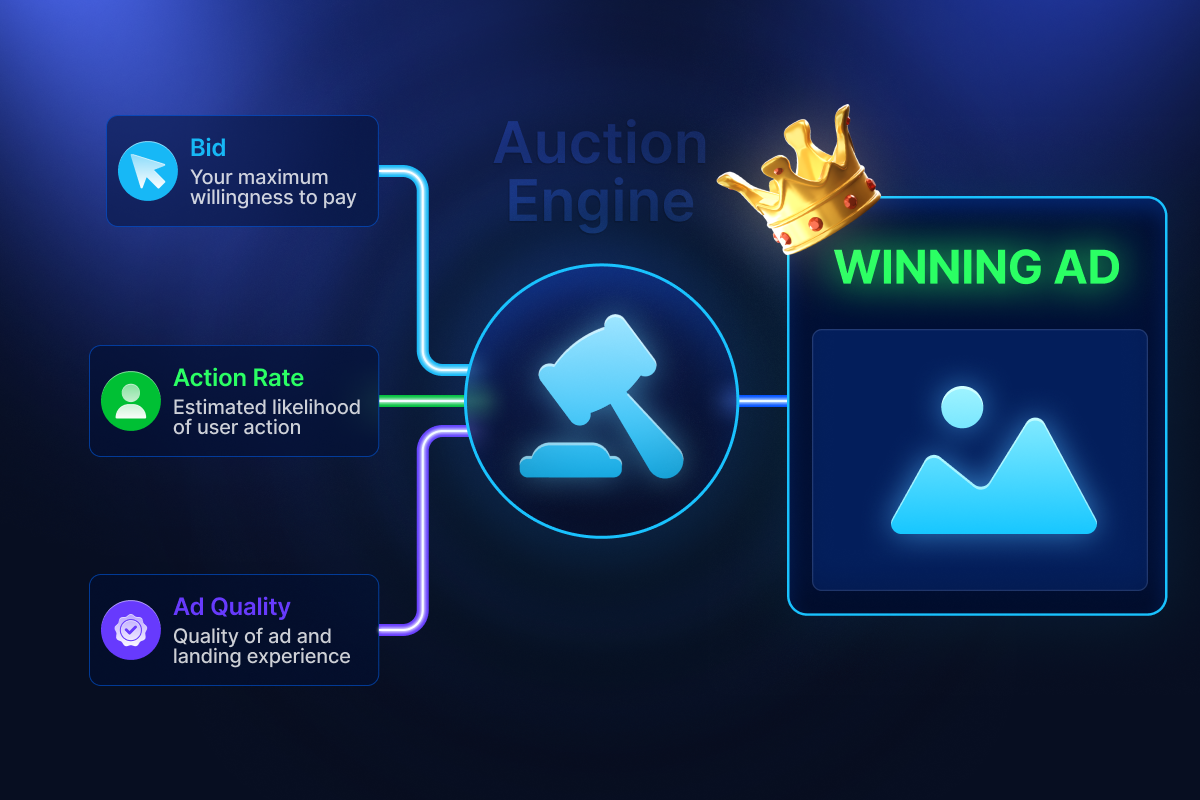
Advertiser Bid: Your maximum willingness to pay per result. Set manually or automatically. Higher bids improve your chances, but don't guarantee the win.
Estimated Action Rate (EAR): Meta's prediction of how likely a specific user is to take your desired action. Powered by behavioral data, conversion history, and engagement signals. A high EAR lets a lower bid outperform a higher one.
Ad Quality: Meta scores ad quality using user feedback, engagement patterns, and landing page experience. Poor ad quality lowers your total value score and inflates your costs even when your bid is competitive.
Meta uses a Generalised Second-Price (GSP) auction, a system in place since 2007. The winner pays only enough to beat the second-highest bidder's Total Value, not their own maximum. In practice, you consistently pay less than your bid cap.
TikTok, LinkedIn, Pinterest, and X operate on broadly similar auction logic, weighting bids against predicted engagement and creative quality. However, the specific signals vary by platform.
How You’re Charged: The Four Pricing Models
In practice, you set a campaign objective, and the platform selects the billing model. The metric you are billed on does not always reflect whether you are getting real value.
A low CPM with a high CPA means you are reaching plenty of people, but your funnel is losing them before purchase.
What Every Major Platform Actually Charges
Here is what ads on social media cost across every major platform, based on the most current available benchmark data.
What the Numbers Mean for Each Platform
Facebook: Traffic CPC dropped 6.67% YoY in 2025, one of the few platform-wide cost decreases. CPL rose 21% in the same period. Cheaper clicks, harder leads.
Instagram: CPMs rose double digits for six consecutive quarters through Q3 2025. Lower-cost Reel placements are moderating this trend, while non-vertical ads receive lower relevance scores and higher CPMs.

TikTok: Budget minimums are higher than Facebook, tripping up smaller advertisers. The CPM advantage from a still-expanding advertiser base is closing. Polished brand content, landscape video, and static images consistently underperform.
LinkedIn: It captures 41% of B2B ad budgets as of 2026. Its high CPM reflects unmatched targeting depth, allowing simultaneous filtering by job title, seniority, company size, industry, and experience.
Pinterest: Advertiser spend on Pinterest rose 66% YoY in Q2 2025 as more brands discover its cost-efficient, purchase-intent audience.
Snapchat: CPMs surged 47% YoY in 2025, the steepest increase among major platforms. Still, a $5/day minimum keeps it accessible for testing, reaching 75% of Gen Z and millennials across 25+ countries.
YouTube: YouTube CPM fell 18% YoY in Q4 2025 as impressions surged. Skippable ads run on a CPV model ($0.02–$0.06 per view), with no charge for views skipped within the first five seconds.
X (formerly Twitter): Advertiser trust fell from 22% in 2022 to 12% in 2024, prompting 26% of marketers to cut spend in 2025. Low CPMs reflect high risk, meaning the platform works best for real-time, conversation-driven categories. (Spiralytics)
How Location Multiplies or Reduces Your Costs
The same campaign targeting a comparable audience can cost 15x more depending on the country. Meta's pricing scales across these market tiers:
Tier 1 markets saw 12% YoY CPM growth in 2025. Tier 3 markets are inflating faster at 15-25% YoY as international advertisers begin testing lower-cost regions. On TikTok, Tier 1 markets average $10–$15 CPM while Southeast Asia runs $1–$3. (TikAdSuite)
The Industry You're In Changes Your Costs
Your industry vertical is one of the biggest cost drivers in paid social, often more impactful than your bidding strategy or creative quality. Two advertisers running identical campaigns can face CPCs that differ by 50% to 400% based on category alone.
Three structural forces drive high-cost verticals:
Facebook/Meta Industry Benchmarks (2025)
LinkedIn Industry CPC Benchmarks (2025–2026)
In 2026, LinkedIn's average CPC jumped 9% YoY to $5.74, outpacing Google Ads B2B inflation. This surge stems from flat professional audience supply coupled with climbing advertiser demand.
How to Set a Budget That Actually Works
The Minimum Spend the Platform Won't Tell You
The real minimum spend on Meta is not the platform's $1/day technical floor. It is the threshold the algorithm needs to learn and stabilize.
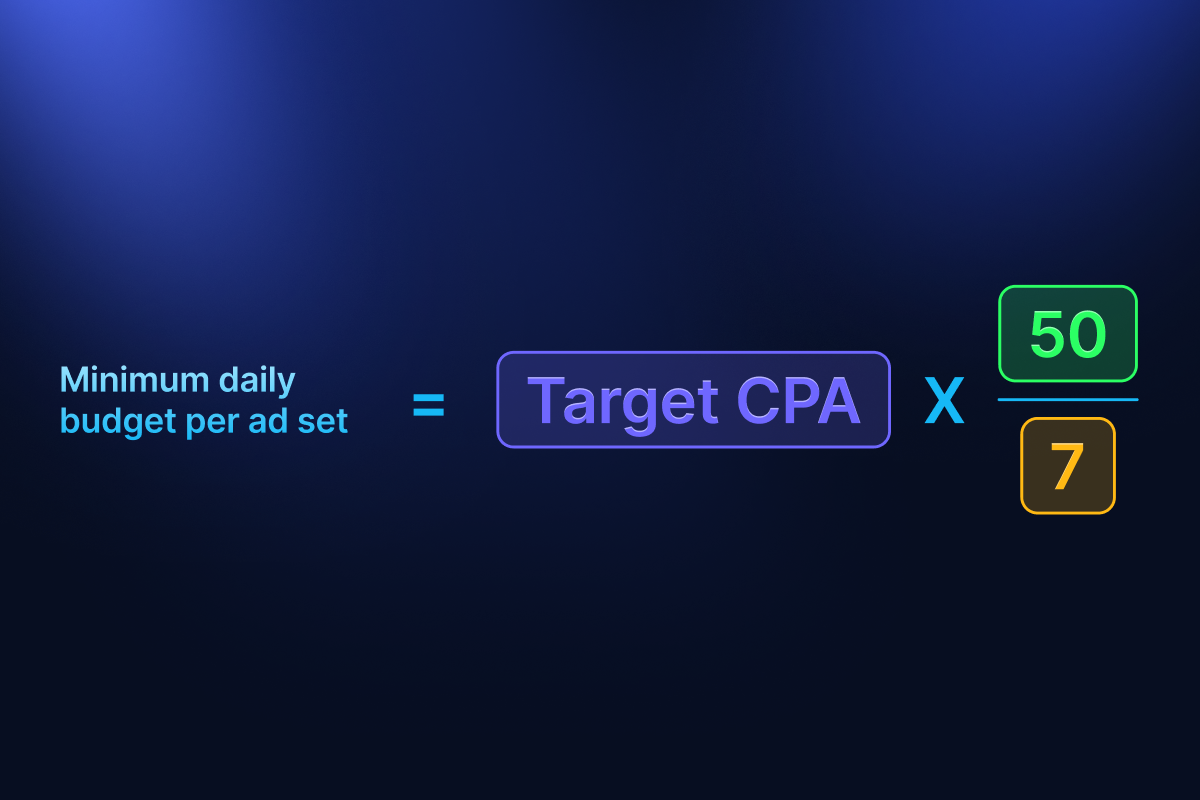
Meta's algorithm needs approximately 50 conversion events per ad set per week to exit the learning phase and deliver consistent results.
Minimum daily budget per ad set = Target CPA × 50 ÷ 7
Daily Budgets vs. Lifetime Budgets
Daily budgets deliver predictable spend and cleaner test data for always on campaigns. Lifetime budgets let platforms front load delivery on high opportunity days, making them better for product launches or time limited promotions.
How to Calculate Your Budget Floor
Reverse-engineer your budget floor from your conversion economics:
For Example: let's say you want 50 leads/month. Estimated CVR is 5%. You need 1,000 clicks. At a $1.50 Facebook CPC, your floor is $1,500/month. If CVR drops to 3%, your floor jumps to $2,500.
Spend Ranges Across Business Types
B2B companies testing LinkedIn below $1,500/month rarely collect enough data to optimize. At $25/day targeting a narrow B2B audience, you generate roughly 60–90 clicks over 30 days and 2–3 leads total.
That is not enough to determine if the campaign works. Enterprise brands should reserve roughly 10% of quarterly budget for new platform or format testing.
The Creative Cost Layer Most Advertisers Forget
The media buys impressions. Creative determines whether those impressions convert. These are separate cost lines, and creative is regularly underbudgeted.
Usage rights are separate from production. Budget 20–30% of the base rate per month on top of production for any whitelisted or dark post usage.
The first 3 seconds of video determine watch-through rate. Paying $50–$100 per additional hook enables systematic A/B testing without reshooting the full asset.

A creative asset can stay fresh for 30 days with a $10,000 budget, but that exact same asset might lose effectiveness within a week when spending $100,000. (Sociummedia)
On TikTok and Snapchat, a weekly refresh is often needed at scale. When CTR drops while CPM holds steady, the creative has gone stale but the audience targeting is still working.
Search Ads vs. Social Ads: Splitting Your Budget Intelligently
Most advertisers choose how to split budgets across channels rather than selecting between social media and nothing. These online advertising rates vary dramatically depending on which channel you prioritize.

Search captures the 5% of your market actively looking to buy, while paid social generates upstream demand by reaching the other 95% at the cost of lower initial conversion rates.
Where Social Beats Search
Social media CPC is significantly lower than search, with Meta up to 7x cheaper in competitive categories. Only social media allows audience discovery targeting to reach buyers matching your profile before they start searching.
New product launches with no search demand yet have nowhere to go but social. Meta retargeting also averages 3.61:1 ROAS versus 2.19:1 for prospecting, making it the strongest retargeting environment available.
Where Search Beats Social
Conversion rates are 3.6x higher on average, time-to-conversion is faster, and B2B lead quality is stronger for high-consideration purchases with long evaluation cycles.
Matching Your Objective to the Right Channel
These channels feed each other. Social builds awareness that generates branded search queries, and cutting social spend reduces search volume over time via delayed cross channel effects. Most high performing accounts run both, allocating by funnel stage. (Hivedigital)
Platform Demographics: Why Your Target Dictates What You Pay
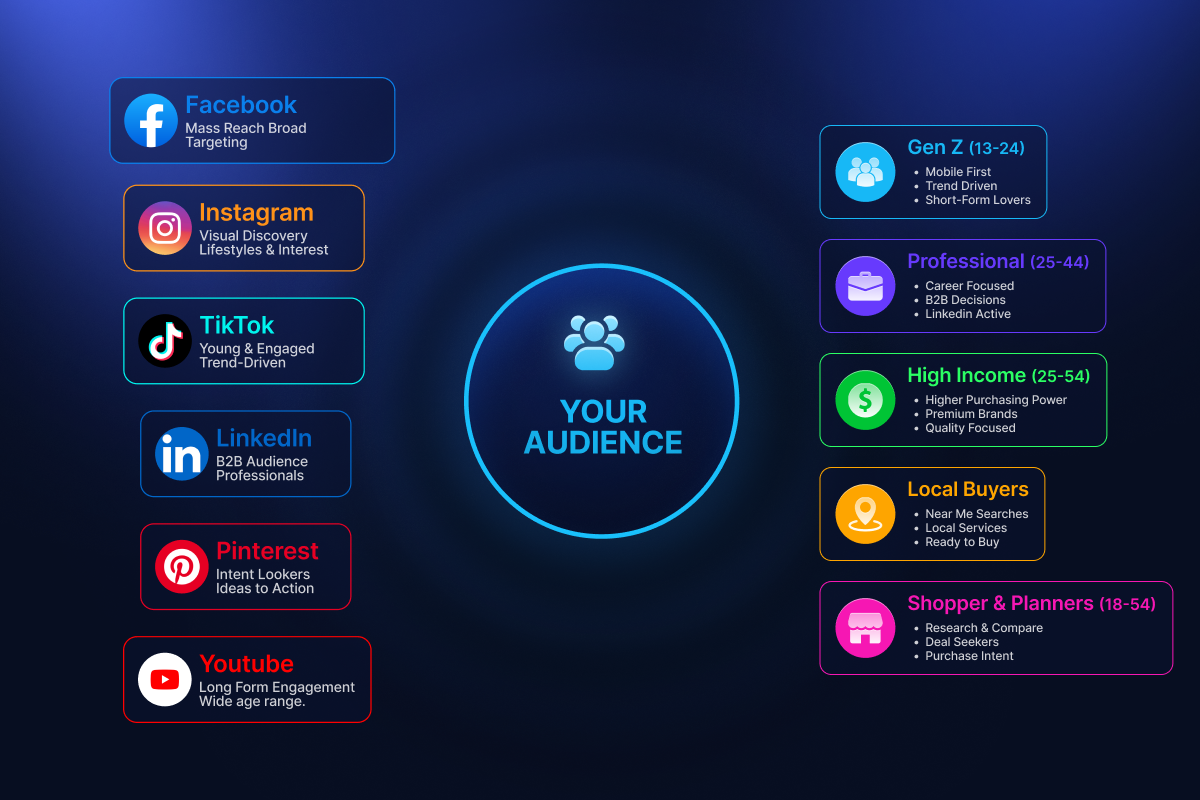
Targeting precision directly controls social media ad costs. Reaching the wrong audience drops engagement and relevance scores, raises CPMs, and degrades algorithmic delivery quality.
Why LinkedIn Lead Gen Forms Lower Your Effective CPL
LinkedIn Lead Gen Forms convert at an average 13% compared to 2.35–4% for external landing pages, which is a 3–5x improvement from auto-populated profile data and zero load-time friction.
At 13% CVR versus 4%, you can afford to pay 3x more per click and still reach the same CPL.
Landing pages tend to generate higher-quality leads. SQL conversion rates often favor landing pages by 20–40% because people who navigated to a page, waited for it to load, and filled it out manually are demonstrably more engaged.
Lead gen forms maximise quantity; landing pages tend to maximise quality. Which matters more depends on where your funnel bottleneck actually sits.
Mobile-First Platforms and the Creative Cost Implication
TikTok and Snapchat are mobile only, while Instagram gets over 56% of its traffic from mobile. Non vertical ads receive lower relevance scores and higher CPMs, making mobile native creative a direct cost control measure.
As per Deloitte, a 0.1 second improvement in mobile load speed increases conversions by 8.4% for retail and 10.1% for travel.
Ad Formats, Objectives, and the Management Layer
How Format Selection Affects What You Pay
Matching Campaign Objectives to Formats
The campaign objective you select determines how the platform's algorithm optimizes delivery.
Running a traffic objective when your actual goal is purchases ranks among the most common and costly mismatches in paid social.
AI-Automated Campaigns: What the Data Shows
Meta's Advantage+ Shopping Campaigns deliver a 32% lower CPA than manually configured campaigns in e-commerce as of 2026, with 78% of Meta advertisers now using some form of Advantage+ automation.
Independent analysis shows Advantage+ typically delivers 15–30% lower CPA for accounts with 100+ weekly conversions and mature catalogs, but underperforms manual campaigns for newer accounts or narrow audiences. (Adligator)
.png)
The optimal approach is hybrid. Use Meta Advantage+ for retargeting, where rich conversion data fuels AI efficiency. Use manual campaigns for prospecting, where strategic audience guardrails outweigh broad automation.
Retail advertisers alone spent more than one-third of their Meta budgets on Advantage+ sales campaigns in Q2 2025, reflecting how rapidly automated formats now dominate social ad spend. (eMarketer)
In-House vs. Agency: The True Cost Comparison
Full in-house paid social management across multiple platforms is realistically a full-time role. A mid-level specialist in the US costs $65,000–$95,000/year in salary before tools and training.
Full-service retainers run $1,000–$5,000/month for small businesses, $7,500–$15,000/month for mid-market, and $15,000+/month for enterprise. Agency fees cover campaign management, while ad spend is a separate budget line paid directly to platforms. (Getmonetizely)
Evaluating Paid Social Performance
Understanding the cost of social media advertising is only half the equation. The other half is what that spending returns.
Return Benchmarks by Platform
A 2:1 ROAS on a 60% margin product is profitable. The same 2:1 on a 30% margin product is not. Translate ROAS into net margin before treating it as a performance signal.
Business Types That Consistently Perform Well
E-commerce brands with repeat purchase potential fit social media best. Visual formats drive discovery, retargeting recaptures warm audiences, and LTV compounds acquisition returns. Beauty brands specifically saw social ROAS hit 3.50:1 in Q1 2025.
B2B SaaS companies with high LTV perform well despite high CPLs. For instance, a $200 CPL that turns into a $24,000 ARR customer yields a 120:1 return, proving that front-end CPL was never the right success metric to measure.
Local service businesses, such as dental, legal, home services, etc., benefit from Facebook's hyperlocal targeting depth, where a single converted customer frequently generates enough revenue to justify even elevated CPLs.
Brands with retargeting audiences see the strongest ROAS on social regardless of vertical.
Business Types That Tend to Struggle
Low-AOV products: where CPL structurally exceeds the margin. No optimization closes that gap without a subscription model or a strong repeat purchase rate.
Complex Enterprise B2B: For companies with a 6 to 12 month evaluation cycle, social media is excellent for building brand awareness. However, direct-response attribution is nearly impossible, and search advertising typically delivers a much better measurable, near-term return.
Brands Without Creative Production Capacity: Without a steady stream of fresh assets, campaign performance decays faster than it can be optimized, especially on TikTok and Snapchat. Today, creative velocity is one of the most predictive indicators of paid social success.
Businesses with Broken Measurement: Accurate tracking is a widespread hurdle, with 21% of marketers citing ROI measurement as their primary social advertising challenge. Simply put, if you cannot measure what happens after the click, you cannot optimize it.
A Pre-Investment Checklist
Checking these factors indicates paid social should deliver measurable returns.
Practical Ways to Spend Less Without Performing Worse
The tactics below carry a documented, quantified impact on cost-per-result
CPM or CPC: Picking the Right Bidding Model
Use CPM when CTR is above 1.5%, and you're running awareness or retargeting campaigns. Use CPC for early-stage testing or in high-CPM environments where you want per-click cost control before establishing conversion baselines.
Dayparting
Dayparting works best below $100/day for time-sensitive promotions and local businesses where conversions only happen during business hours. Above $300/day, algorithmic delivery outperforms manual scheduling.
Automatic placements average 12% better cost efficiency than manual selection. But you should track cost per result instead of CPM only.
Page Speed Is a Hidden CPA Driver
A landing page loading in 1 second converts at 9.6%. At 5 seconds, that drops to 3.3%, a 191% gap from load time alone. Target under 2 seconds for mobile Largest Contentful Paint before increasing spend.

Slow pages compound the problem: fewer conversions → less algorithm data → worse delivery → higher CPA → even fewer conversions.
Use Platform Forecasting Tools Before Committing Budget
Every major platform has pre-launch modeling tools worth using before you commit a budget.
Meta's audience estimator and budget forecasting, TikTok's Reach and Frequency planner, and LinkedIn's forecasted results all surface the same critical warnings: audience too small to exit learning, bid too low to win meaningful impressions, or a seasonal CPM spike incoming.
Final Thoughts
Paid social advertising doesn't have a price; rather, it has a structure that rewards the advertisers who understand it. What you pay is the output of decisions you make about the platform, targeting precision, creative quality, and how well your post-click experience converts.
The brands generating the strongest returns aren't necessarily spending the most. Instead, they treat cost per result as their ultimate metric, systematically improving every single variable that feeds into it.
Paid social works best when the economics make sense, the creative is built for the platform, and measurement is solid enough to act on. Get those foundations right, then scale.
FAQs


Latest blogs
ABM Stats: 2026 Benchmarks, ROI & Trends
From ROI to pipeline velocity, these 2026 ABM stats show exactly why account-based marketing dominates B2B growth.
.jpg)
The Real Price of Social Media Advertising: A Cost Guide for Advertisers
Find out what social media ads actually cost these days. Get to know about CPC, CPM, CPL, industry verticals, budget ranges, and ROAS across major platforms.
Bing Ads Cost in 2026: Everything You Need to Know
Stop wasting money on ad spend. See the 2026 Bing Ads cost benchmarks, real industry CPAs, and hidden ROI data you need to outperform competitors.

6 Best AI UGC Video Creators for TikTok Ads in 2026
Avoid expensive creators. Find the 6 best AI UGC video platforms for TikTok ads in 2026. Cut production costs, test faster, and scale your ROI.
TikTok Ads Statistics 2026: Benchmarks, Rates and Performance Data
With 8.7M businesses competing, discover key TikTok ads statistics and different benchmarks to beat the competition and refine your ad performance.
Static vs Dynamic Ads: Key Differences, Examples & How to Choose in 2026
Compare static and dynamic ads, their key differences, examples, and when to use each format to improve targeting, conversions, and ROI in 2026.
Geographic Segmentation: Definition, Variables, Examples & How Marketers Use It
Stop wasting ad spend on guesswork. Geographic segmentation uses location data to reach the right audience at the right place and drive real ROI.
How to Manage Multiple Facebook Accounts on One Device
Learn how to manage multiple Facebook accounts on one device safely using browser isolation, account separation, AdsPower, and Uproas tools.

Bing vs Google Ads: Which Advertising Platform Is Better in 2026?
Confused between Bing vs Google ads? Learn the key differences, including cost, reach, and performance. Pick the right ad platform for your business.