ROAS Benchmarks: Industry, Platform & Profitability Data (2026 Guide)

Standard ROAS values can range anywhere from 2:1 to 4:1. However, since ROAS is strongly connected to revenue, it depends heavily on the industry. In a nutshell, it can be confusing to understand what a good ROAS is.
Some industries make more revenue with fewer ads, while others do not. ROAS values help you get an idea about the profitability of ads in that industry.
Measuring your ROAS is a good way to compare the profitability of your ad campaigns with others in the market.
However, it is quite hard to get a good read on your ROAS, and even harder to find a standard to compare to. ROAS benchmarks only carry meaning when they are of the same industry and campaign type.
But before exploring the industry benchmarks, it is important that you fully understand what ROAS is. Return on Ad Spend or ROAS is simply a measure of how much money you’re making from your ads for every dollar spent on it.
It is a direct way to measure your revenue versus the amount you spent on the campaign. This also makes it difficult to measure, as you may have to track it with some manual help.
This blog dives deep into profitability data and best ROAS benchmarks of each industry in 2026 and explores how you can beat these benchmarks and achieve a competitive value.
What is ROAS?
ROAS stands for Return on Ad Spend, and it is one of the most important metrics in digital marketing. At its core, ROAS tells you how much revenue your business earns for every dollar spent on advertising.
Instead of guessing whether your campaigns are working, ROAS gives you a clear financial measurement of ad performance.
When calculating ROAS, accuracy matters. Many advertisers make the mistake of including only media spend, but true ROAS should account for all advertising-related costs. This can include platform fees, creative production, landing page development, agency fees, and bid management tools.
ROAS only measures revenue directly attributed to advertising, meaning it focuses purely on ad performance rather than total business income.
How to Calculate ROAS
How ROAS Benchmarks Are Used in Performance Analysis
ROAS benchmarks function as empirical yardsticks for assessing advertising productivity and capital efficiency.
Organizations compare their campaign-level return on ad spend benchmarks against three principal reference points: industry median ROAS, platform median ROAS, and break-even ROAS.
When advertisers benchmark against industry medians, they contextualize results within sector-specific economics such as pricing power, demand elasticity, and conversion behavior. Performance evaluation also relies on cross-channel comparisons.
Meanwhile, comparing against platform medians exposes efficiency disparities across ecosystems like search advertising, social media advertising, and programmatic display.
This multi-dimensional analysis clarifies where marginal advertising dollars generate the highest incremental returns.
A third evaluative lens involves break-even ROAS, which determines the minimum return required to cover operational costs, production expenses, and marketing investment.
Unlike industry comparisons, break-even thresholds represent internal financial constraints rather than competitive benchmarks.
Firms use this metric to assess campaign sustainability and establish minimum performance expectations independent of external market conditions.
This comparative process reveals whether advertising expenditure merely offsets costs, generates sustainable profit, or achieves exceptional economic surplus.
By situating performance within these reference ranges, marketers can diagnose inefficiencies in bidding architecture, audience targeting precision, and creative resonance.
What is a Good ROAS?
There’s no single number that defines a “good” ROAS for every business. What counts as strong performance depends on your industry, profit margins, pricing model, and how your business generates revenue over time.
That said, general benchmarks can give you a useful starting point.
Across Google Ads campaigns, the average ROAS is often cited at around 2:1 (200%), meaning businesses earn $2 for every $1 spent on advertising. In fact, broader performance data from Google suggests that many advertisers see returns around this level, with stronger results on the Search Network sometimes reaching as high as 8:1 in well-optimized campaigns.
For example, if a company spends $9,000–$10,000 per month on ads and earns $2 for every $1 invested, that translates into roughly $18,000–$20,000 in monthly revenue from advertising.
In general marketing discussions, a good ROAS often falls between 2:1 and 4:1 (200%–400%). At this level, campaigns are typically considered efficient and scalable. However, whether that range is truly “good” depends entirely on your costs.
A business with slim margins may need a much higher ROAS just to break even, while a company with strong margins can remain profitable at lower returns.
Why “Good” ROAS Depends on Business Models
Business models also make a big difference. E-commerce brands often aim for higher ROAS because product costs, shipping, and operational expenses reduce profit margins.
On the other hand, SaaS or subscription-based companies may accept a lower initial ROAS because customers generate recurring revenue over months or years. In these cases, lifetime value matters more than immediate returns.
Mobile app campaigns behave differently from traditional e-commerce as well. Early user acquisition efforts frequently produce lower ROAS, sometimes even below 1.0 in the early stages. That doesn’t necessarily signal failure.
Many apps monetize through in-app purchases, ads, or subscriptions over time, meaning the real value appears later in the user journey. Retargeting campaigns, however, often deliver higher ROAS because they focus on users who already know the product and are more likely to convert.
Ultimately, a good ROAS is one that aligns with your break-even point and profit goals. The right target should cover your advertising costs, product or service expenses, and leave room for sustainable growth.
Benchmarks provide context, but your financial structure, customer lifetime value, and growth strategy determine what “good” truly means for your business.
ROAS Standards for Different Business Models
Distinct commercial architectures generate divergent ROAS ranges because they differ in revenue timing, customer value accrual, and acquisition costs.
These structural differences explain why ideal ROAS thresholds vary between transactional commerce, subscription businesses, and service-based models.
Ecommerce (DTC & Retail)
Ecommerce firms typically operate with high transaction volume and margin sensitivity, producing relatively elevated expectations for advertising efficiency.
Industry research indicates that ecommerce advertisers often achieve average ROAS between 2:1 and 4:1, with top-performing retailers exceeding 6:1 to 8:1 under optimized conversion environments.
Performance variability arises from factors such as product pricing, inventory turnover, shipping costs, and discount strategies.
Ecommerce ROAS Characteristics
Repeat purchase behavior significantly alters ecommerce ROAS expectations. Brands with strong customer retention and brand loyalty often experience amplified lifetime value, allowing them to tolerate lower initial acquisition efficiency while maintaining long-term profitability.
Conversely, low-retention commodity retailers require higher immediate ROAS to sustain operational viability.
SaaS & Subscription
Software-as-a-service enterprises prioritize customer lifetime value rather than immediate transaction revenue, resulting in lower short-term ROAS thresholds.
Industry benchmarks suggest SaaS firms frequently operate with initial ROAS ranges of 1.5:1 to 3:1, as recurring subscription revenue accumulates over time. Advertising efficiency is therefore evaluated longitudinally, emphasizing retention, expansion revenue, and churn reduction.
SaaS ROAS Economics
The LTV-driven economics of subscription models shift performance evaluation toward payback period and customer acquisition cost recovery rather than immediate profitability.
Consequently, lower short-term ROAS may still represent superior long-term value creation when customer relationships persist over extended durations.
Lead Generation & Services
Lead generation and service-oriented industries exhibit delayed revenue realization due to prolonged sales cycles, consultation processes, and contract negotiations.
Benchmark data indicates initial ROAS frequently ranges from 2:1 to 5:1, though realized returns may materialize months after initial advertising exposure. This temporal lag complicates short-term performance evaluation.
Lead Generation ROAS Drivers
Offline conversion attribution further obscures measurement accuracy. Revenue generated through sales teams, phone inquiries, or in-person transactions is often difficult to connect directly to digital advertising exposure, producing conservative ROAS estimates relative to actual business impact.
Comparative ROAS Benchmarks by Business Model
(Sources: Sales Force; Hubspot)
ROAS Depends on Profit Margins
Profit margins represent the most decisive determinant of the minimum ROAS for profitability.
Businesses with narrow margins require substantially higher advertising efficiency to offset production costs, logistics expenses, and operational overhead, whereas high-margin firms can maintain profitability with comparatively lower returns.
The standard break-even ROAS formula is:
Break-even ROAS = 1 / Profit Margin
This relationship demonstrates how margin structures determine acceptable advertising performance thresholds.
For example, a firm with a 20% profit margin requires a 5:1 ROAS to break even, whereas a business with a 50% margin requires only 2:1 ROAS. These thresholds define the lower boundary of economically viable advertising performance.
Margin elasticity further explains sectoral differences in best ROAS expectations. Luxury goods brands with high markups can operate profitably at lower ROAS levels, while low-margin commodity retailers must maintain higher efficiency to sustain operations.
This financial heterogeneity underscores why a singular good ROAS benchmark cannot be universally defined.
Break-even ROAS by Profit Margin
ROAS Benchmarks by Advertising Platform (2026 Data)
Advertising platforms exhibit distinct ROAS dynamics due to differences in user intent, auction mechanics, targeting precision, and attribution modeling.
The following tables synthesize median, top-quartile, and bottom-quartile performance ranges based on aggregated data from platform reports, agency benchmarks, and industry studies.
Google Ads ROAS Benchmarks
ROAS is a significant part of Google Ads benchmarks that you need to keep an eye on. Google Ads performance varies substantially across campaign types due to differences in purchase intent.
Search campaigns capture high-intent demand, Shopping campaigns optimize transactional conversion, and Display campaigns emphasize reach and awareness.
Google Ads ROAS Benchmarks by Campaign Type (2026)
Google Ads Performance Tier Interpretation
Meta (Facebook & Instagram) ROAS Benchmarks
Meta advertising performance depends heavily on audience temperature and creative quality. Social advertising is interruption-driven rather than intent-driven, producing distinct ROAS expectations between prospecting and retargeting campaigns.
Facebook’s ads benchmarks show a very distinct difference between ROAS values for cold, warm, and broad audiences.
Meta Ads ROAS Benchmarks (Facebook & Instagram)
Creative Fatigue Impact on ROAS
Creative fatigue occurs when advertising audiences repeatedly see the same ad content, reducing engagement and conversion efficiency over time, particularly on platforms like Meta where ad exposure frequency is high.
Newly launched creatives typically generate peak ROAS due to novelty and strong user engagement. After roughly two to four weeks, performance stabilizes as audience response normalizes.
Between five and eight weeks of continuous exposure, ROAS generally begins to decline as audience interest diminishes and click-through rates decrease.
With extended exposure, performance often drops significantly because repeated impressions reduce responsiveness, increasing acquisition costs and lowering overall advertising efficiency.
TikTok Ads ROAS Benchmarks
TikTok operates as a discovery-first advertising ecosystem where users encounter products organically. TikTok also has a very different ad cost model compared to other platforms which significantly impacts what the best ROAS can be.
This produces lower initial ROAS but stronger assisted conversions across multi-touch attribution models.
TikTok Ads ROAS Benchmarks
TikTok Attribution Characteristics
Advertising on TikTok follows a discovery-driven distribution model that shapes how ROAS is measured and interpreted.
Discovery-based exposure often produces lower initial ROAS because users encounter products passively rather than through direct purchase intent.
However, high engagement rates frequently generate strong assisted conversions, where users later convert through other channels.
TikTok campaigns also influence cross-platform purchasing behavior, which can lead to underreported direct ROAS since conversions may occur outside the platform.
Additionally, its algorithmic content distribution creates rapid performance variability, causing ROAS outcomes to fluctuate more than in intent-driven advertising environments.
Amazon Ads ROAS Benchmarks
Amazon Ads operates within a high-intent marketplace environment where users demonstrate strong purchase readiness. This transactional context typically produces higher ROAS compared to social platforms.
Amazon Ads ROAS Benchmarks
Advertising within Amazon occurs in a high-intent shopping environment, which typically produces higher conversion rates due to strong purchase readiness.
Product-level targeting improves efficiency by matching ads with specific buyer searches, but competitive bidding can increase costs and compress margins.
At the same time, marketplace attribution enables more accurate revenue tracking because the full purchase journey occurs within one platform.
ROAS Benchmarks by Industry
Industry economics significantly influence average ROAS by industry due to variations in margins, customer lifetime value, and demand elasticity. The following tables present aggregated sector performance ranges.
Ecommerce Industry ROAS Benchmarks
Ecommerce ROAS by Sector (2026)
(Sources: FirstPageSage, Landingi, Segwise, WebFX)
SaaS & B2B Industry ROAS Benchmarks
SaaS and B2B ROAS Benchmarks
(Sources: FirstPageSage, Landingi, Segwise, WebFX)
Local Services & Lead-Based Industries
Local Service ROAS Benchmarks
(Sources: FirstPageSage, Landingi, Segwise, WebFX)
ROAS Benchmarks vs Related Metrics
ROAS measures advertising efficiency, but it does not capture total profitability, customer acquisition economics, or overall marketing effectiveness.
Comparing ROAS with related metrics such as ROI, CAC, and MER provides a more comprehensive evaluation of marketing performance and business sustainability.
ROAS vs ROI
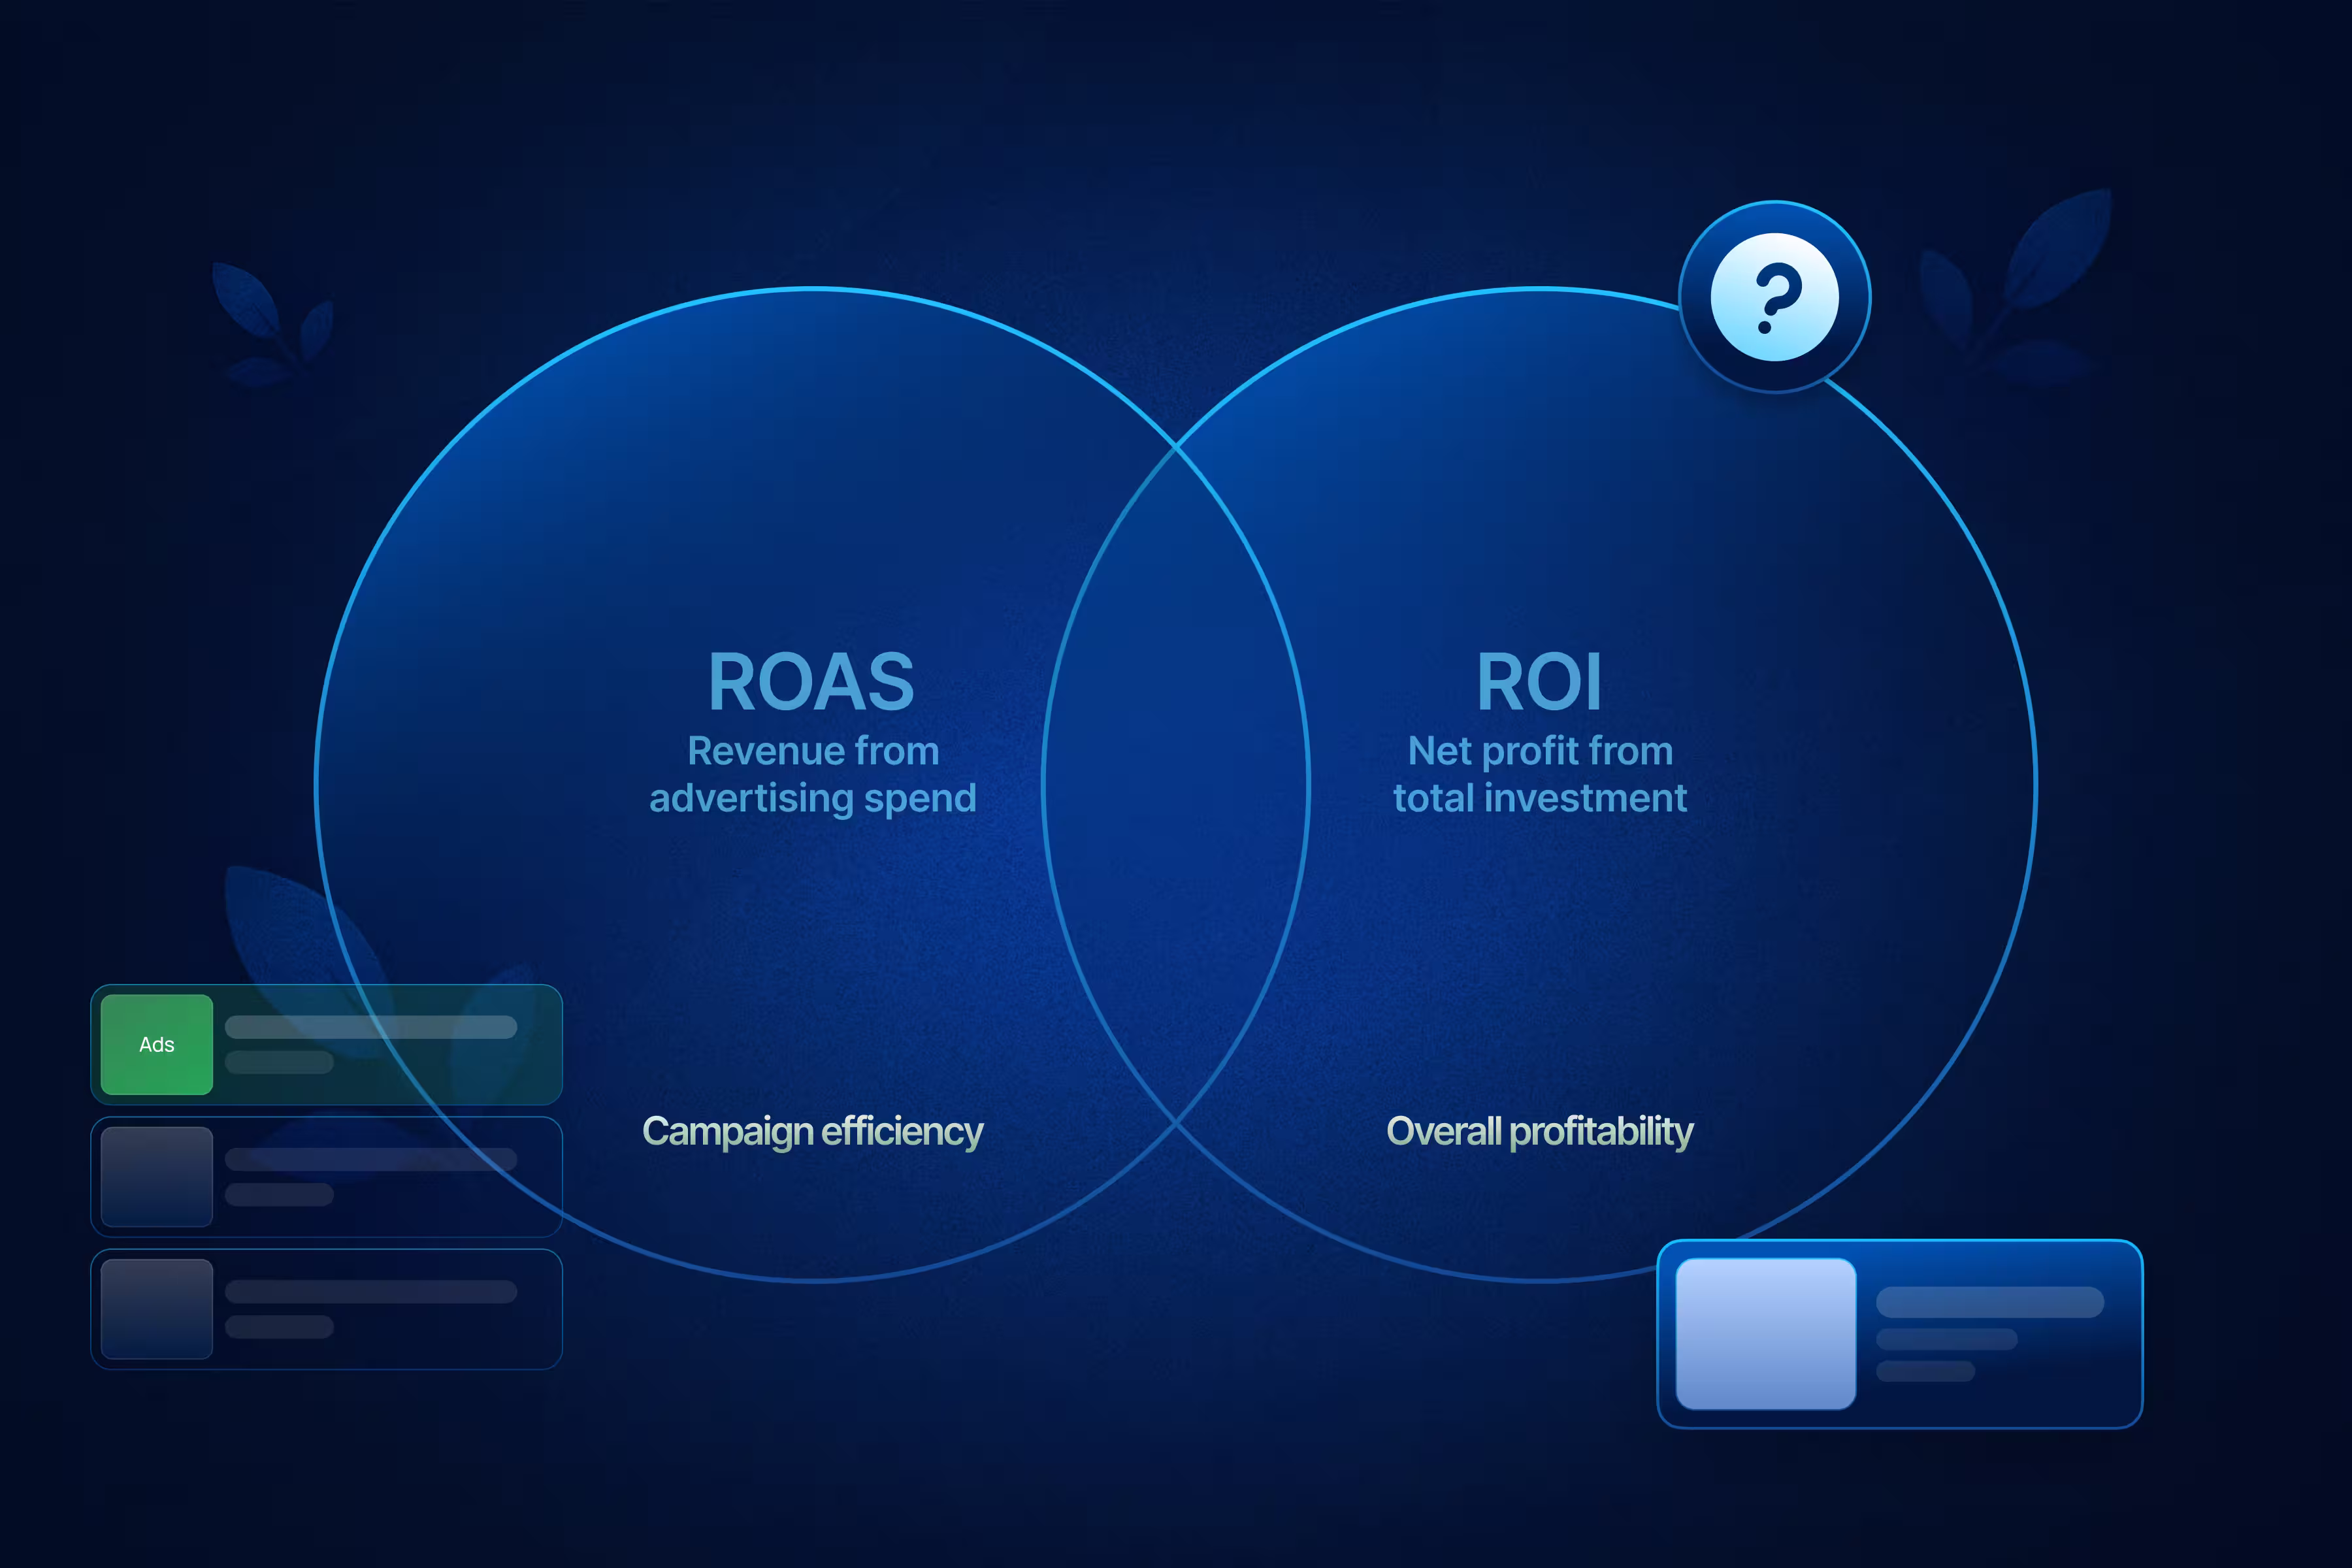
ROAS evaluates revenue generated specifically from advertising spend, whereas ROI measures total business profitability after accounting for all operational costs.
The distinction determines whether a campaign appears efficient but financially unsustainable.
(Sources: FirstPageSage)
ROAS vs CAC
ROAS measures revenue output from advertising, while Customer Acquisition Cost (CAC) measures the expense required to acquire each customer.
CAC is particularly important for subscription businesses and lifetime-value-driven models where customer relationships extend beyond immediate transactions.
ROAS vs MER (Marketing Efficiency Ratio)
Marketing Efficiency Ratio (MER) evaluates total revenue relative to overall marketing spend, offering a portfolio-level efficiency perspective, whereas ROAS focuses on individual campaign or channel performance.
Paid vs Organic ROAS Benchmarks

Paid and organic channels exhibit fundamentally different efficiency dynamics due to attribution models, cost structures, and temporal value creation.
Paid media delivers immediate measurable returns, while organic channels generate cumulative long-term value with declining marginal costs.
Paid vs Organic ROAS Comparison
Attribution Bias in ROAS Measurement
Attribution models influence how revenue is credited across marketing channels.
Paid campaigns often receive disproportionate credit under last-click attribution, while organic channels frequently drive upstream demand that remains underreported.
Short-Term vs Long-Term Efficiency
Paid and organic strategies differ in temporal efficiency. Paid advertising prioritizes immediate returns, whereas organic channels optimize long-term customer value and sustainable growth.
How to Set Your Own ROAS Benchmarks
Organizations should establish internal ROAS targets based on profitability constraints, growth objectives, and funnel economics rather than relying solely on external benchmarks.
ROAS Benchmark Misinterpretations
ROAS is frequently misconstrued as a definitive indicator of profitability, yet it measures only the revenue generated relative to advertising expenditure.
Because it excludes operational costs, production expenses, and overhead, a campaign may demonstrate strong advertising efficiency while still producing financial losses.
Consequently, interpreting ROAS without broader financial context can lead to inaccurate performance conclusions.
Why a High ROAS Can Still Lose Money
A high ROAS does not necessarily indicate business profitability because advertising metrics typically exclude backend operational costs. Expenses such as cost of goods sold, inventory management, shipping and fulfillment, product returns, and platform fees substantially influence net margins but are not reflected in standard ROAS calculations.
Cost of goods sold directly reduces gross margin by increasing the expense associated with each sale. Inventory holding costs constrain capital and introduce storage-related expenses that diminish realized profit.
Shipping and fulfillment costs further increase operational expenditure, particularly in ecommerce environments with complex logistics networks. Returns and refunds erode revenue by reversing completed transactions, while platform fees compress margins through commissions and service charges.
A campaign may therefore appear highly efficient from an advertising perspective while remaining financially unsustainable after accounting for these additional expenditures.
Why Low ROAS Can Be Strategic
Conversely, a low ROAS is not always indicative of poor performance. In many cases, organizations intentionally accept lower short-term advertising returns to achieve long-term strategic objectives.
This approach is common in growth-focused business models where customer lifetime value exceeds initial acquisition cost.
During new customer acquisition initiatives, companies may invest heavily in advertising to expand their customer base, expecting future repeat purchases to offset initial losses.
In market entry phases, businesses often prioritize brand awareness and demand generation over immediate profitability to establish competitive presence. Product launches similarly emphasize visibility and trial adoption rather than short-term revenue efficiency.
Subscription-based models frequently tolerate low initial ROAS because recurring revenue streams recover acquisition costs over time.
These scenarios illustrate that advertising efficiency must be evaluated across the customer lifecycle rather than within a single transaction window.
Conclusion
This discussion shows that the effectiveness of advertising is complex and depends on many factors. While ROAS benchmarks are helpful for seeing how you compare to competitors, they shouldn't be the only measure of your company's financial success.
We've shown that the best ROAS target isn't a fixed number. Instead, it's a number customized for your specific profit margin, business model, and growth goals.
Simply chasing the average performance metric can lead to poor capital decisions, overlooking key factors like customer lifetime value and the real cost of your operations.
To truly move past average results and achieve sustainable profit, you need a smarter, less constrained approach. Underperforming results often come from limitations you impose yourself whether in budget, structure, or analysis.
To reach a higher ROAS, you need an infrastructure built for maximum speed and unrestricted resource allocation.
If your business is ready to break free from standard ad-account limitations and realize its full performance potential, try using agency ad accounts from Uproas.
By combining custom limitless advertising potential with 24/7 support, Uproas helps you achieve a truly exceptional ROAS, one based on the best performance of your specific business economics, not just industry averages.
This is not a small improvement; it's a fundamental redesign of how efficiently you use your advertising budget.


Latest blogs
Bing Ads Cost in 2026: Everything You Need to Know
Stop wasting money on ad spend. See the 2026 Bing Ads cost benchmarks, real industry CPAs, and hidden ROI data you need to outperform competitors.

6 Best AI UGC Video Creators for TikTok Ads in 2026
Avoid expensive creators. Find the 6 best AI UGC video platforms for TikTok ads in 2026. Cut production costs, test faster, and scale your ROI.
TikTok Ads Statistics 2026: Benchmarks, Rates and Performance Data
With 8.7M businesses competing, discover key TikTok ads statistics and different benchmarks to beat the competition and refine your ad performance.
Static vs Dynamic Ads: Key Differences, Examples & How to Choose in 2026
Compare static and dynamic ads, their key differences, examples, and when to use each format to improve targeting, conversions, and ROI in 2026.

Geographic Segmentation: Definition, Variables, Examples & How Marketers Use It
Stop wasting ad spend on guesswork. Geographic segmentation uses location data to reach the right audience at the right place and drive real ROI.

How to Manage Multiple Facebook Accounts on One Device
Learn how to manage multiple Facebook accounts on one device safely using browser isolation, account separation, AdsPower, and Uproas tools.

Bing vs Google Ads: Which Advertising Platform Is Better in 2026?
Confused between Bing vs Google ads? Learn the key differences, including cost, reach, and performance. Pick the right ad platform for your business.

7 Best Klaviyo Agencies for Ecommerce Brands in 2026
Looking for a reliable Klaviyo email marketing agency for your ecom business? Here is our list of 7 best Klaviyo agencies for e-commerce you should consider.
.avif)
ROAS Benchmarks: Industry, Platform & Profitability Data (2026 Guide)
Master ROAS benchmarks with this 2026 guide. Get industry, platform (Google, Meta, TikTok, Amazon), and profitability data, plus how to set your own targets.