Facebook Users Statistics (2026): Global Numbers, Demographics, Growth & Trends

Our data on Facebook users statistics shows that as of 2026, Facebook has around 3.07 billion users. 83% Marketers claim that this single platform helps them to grow.
Yes, new social platforms pop up all the time. But Facebook still has a massive number of regular users. They keep growing, and people check the app almost every day.
People want to know if Facebook is still growing. They ask which age groups use it most. They wonder where new users come from. Also, they want to see how often people actually use the app.
Younger people do try newer apps, but Facebook still works for most age groups. It works in most countries, too. Facebook is the leading social network in 157 out of 167 countries, which is around 94% of the entire world. (Source: Vincos)
Today, we will show you Facebook's current user numbers, how many people use it, how often they use it, and you'll see where growth is happening in 2026.
Facebook Users: Key Statistics at a Glance
Facebook keeps adding new users. The numbers tell an interesting story.
Here's what the data shows:
- Total users worldwide: 3.07 billion people use Facebook each month. That's the same number who log in monthly.
- Daily users: 2.11 billion people check Facebook every single day.
- Growth: Ad reach grew 4.3% this year.
- Biggest audience: India leads with 384 million users.
- Usage patterns: The average person opens Facebook 17 times a day. Each visit lasts about 3 minutes and 42 seconds.
- Age: Most users are between 25 and 34 (31% of everyone on the platform). The 18 to 24 crowd at 23.2%.
- Access: 81.8% of users stick to their phones. No laptop. No desktop. Just mobile.
- Ad potential: Brands can reach 2.28 billion users through ads.
- Market dominance: 56.9% of social media users have used Facebook in the last month, which is the highest among all platforms
- Regional growth: Africa saw a high growth rate of 6.5% in 2025.
How Many Facebook Users Are There Worldwide?
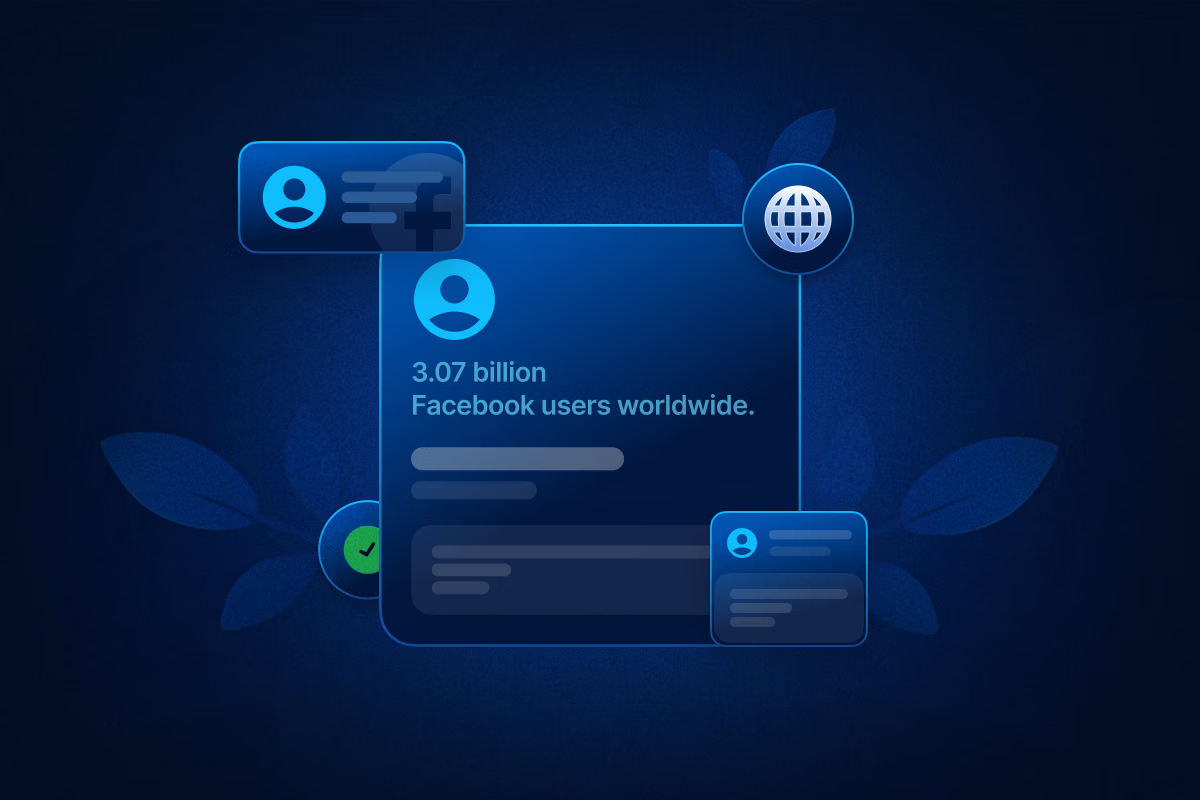
3.07 billion. That’s the number of Facebook users worldwide.
Not all users are equal. Someone who signed up in 2012 and never came back? That's different from someone scrolling right now.
Facebook counts three types of users: registered users, monthly users, and daily users.
Facebook is massive. We're talking bigger than any country on Earth. More people use Facebook than live in China or India. It's not just big, it's continent-sized big.
And it's not like everyone's from the same place, either.
People from every corner of the world use it. Different languages, different cultures, different income levels. Facebook stopped being just a social network years ago. Now it's how billions of people connect.
Total Registered Facebook Users
Total registered Facebook accounts is a complicated number. Getting an accurate Facebook user count can be approached in a few ways.
Think about it. Every account ever made counts. Your old college profile, you forgot about. That spam account your cousin made in 2009. The fake business page someone abandoned after a week.
They all add up to one big, bloated number that doesn't tell you much.
Here's what that total includes:
- Dead accounts gathering digital dust
- People with three profiles (we all know someone)
- Accounts nobody touched in years
- Business pages that went nowhere
Facebook knows this. That's why they don't wave around the "total registered" number anymore. Instead, they focus on who actually shows up. Monthly active users (3.07 billion). Daily active users (2.11 billion). Real people doing real things.
Sure, billions have signed up over the years. But how many are actually there right now? That's what matters.
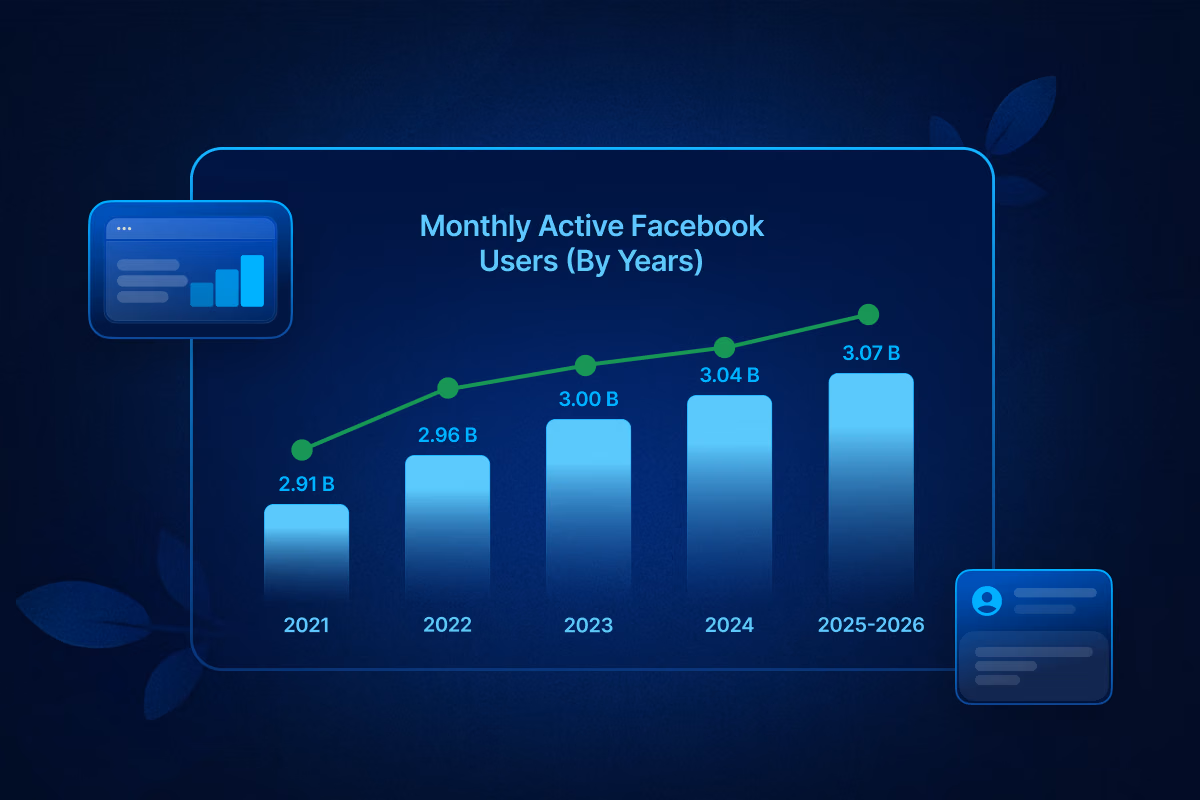
Monthly Active Facebook Users (By Years)
Monthly Active Users are people who log into Facebook at least once in 30 days. Facebook uses this number to track how many people use the platform worldwide.
Facebook keeps adding users each month. But the growth has slowed down compared to its early boom years.
Facebook Monthly Active Users Over Time
MAU over time helps determine the Facebook users by year and the growth of these users over time.
Daily Active Facebook Users (DAU)
Daily Active Users represent individuals who access Facebook every day, which is an essential measure of platform engagement and habitual usage. Facebook daily active users would be 2.11 billion users in 2026. Also, DAU/MAU ratio is around 68.7%
A DAU/MAU ratio near 70% means people can't stay away. Most users who sign up come back every single day. That's not casual browsing. That's a habit. Facebook has built one of the stickiest platforms on the planet. (Source: Meta)
Facebook and Messenger App Downloads
Facebook ranks the fourth most downloaded social media app, coming in just behind YouTube, Whatsapp and Instagram. 77.1% of all smartphones around the world have Facebook installed. Users of other social media apps are also around 70-80% likely to download and use Facebook.
Facebook messenger also ranks as the 3rd most used social messaging app, coming behind Whatsapp and WeChat. It was also the 4th highest downloaded app in 2025, with 17.77 billion monthly downloads. This makes messenger a highly popular and still growing app in the user base, with only Whatsapp, WeChat and Snapchat getting downloaded more. (Source: Exploding Topics)
Understanding Facebook’s Global Scale
The platform has some serious advantages working in its favor. Billions of people already use it, which makes it hard for anyone to leave.
Your friends are there. Your family is there. Your weird uncle who shares too many memes is definitely there.
People of all ages use Facebook now. Boomers post vacation photos. Gen Z uses Marketplace. Millennials; well, they're still figuring out their relationship status. Facebook dominates in emerging markets. Places where internet access is still new.
For many people, Facebook is the internet.
Meta (Facebook's parent company) ties everything together. Instagram, WhatsApp, Messenger. They all connect. You can't escape even if you try. Shopping happens on Facebook now. So does messaging. And watching videos. It's become a one-stop shop.
Most of Facebook's new users come from Asia-Pacific and developing countries. The US and Europe? Growth has flatlined. People there aren't signing up in droves anymore. But they're not leaving either.
Here's what matters: people still use Facebook every single day. A lot.
This tells us something important. Facebook isn't just a place to share photos anymore.
It's where people get their news. Where they chat. Where they buy and sell stuff. It's become part of the daily routine.
Facebook Users by Country
You'll see where Facebook hit its ceiling and where it's still growing fast.
Top 10 Countries by Facebook User Count
Facebook Penetration Rate by Country
Want to know how hooked a country really is on Facebook? That's what the penetration rate tells you.
The math is dead simple. Take the number of Facebook users, divide by total population, and multiply by 100.
Penetration rate = Facebook users ÷ total population × 100
This number shows you something raw user counts can't. A country might have 50 million Facebook users. Sounds huge, right? But if 500 million people live there, that's only 10% penetration.
Now picture a tiny island nation with 2 million people. If 1.8 million use Facebook, that's 90% penetration. Way more saturated.
High penetration means the party's packed. Most people who'd join Facebook already have. Growth slows down. Everyone's fighting for attention. Businesses stop chasing new users and start chasing loyalty. They personalize. They retarget. They get creative with engagement.
Low penetration? That's wide-open territory. Internet access is spreading. More people are buying smartphones. Digital skills are catching up. For Meta, these spots are goldmines. They invest in infrastructure. They build features for slower networks. They plan long-term.
So when you see a penetration rate, you're seeing more than a percentage. You're seeing whether a market is tapped out or just warming up.
High Saturation Markets (Mature)
Some countries have turned Facebook into a daily habit. Most people already use it there. They chat with friends, watch videos, and run their businesses. They check the news. You name it.
Look at the numbers:
- Philippines: 76.4%
- Vietnam: 75.1%
- Mexico: 71.5%
- Thailand: 69.8%
- United States: 57.6%
Facebook already reached most people in these places. So what happens next? The platform can't really add tons of new users. Most folks already have accounts.
Growth looks different now. People spend more time on the app. They use new tools. Businesses buy more ads.
But the days of explosive user growth? Those are behind us in these markets.
Growth Markets (Expansion Potential)
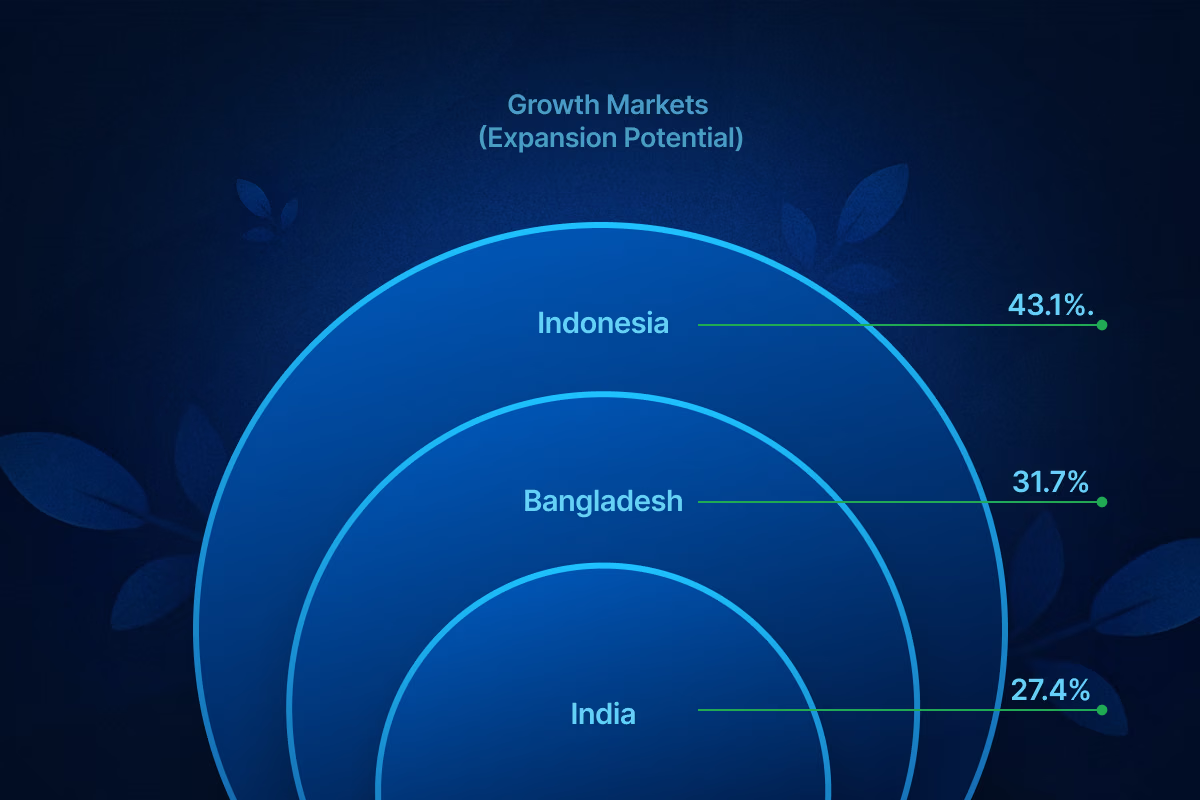
Some countries haven't caught up yet. But that's where the big wins are hiding.
India sits at 27.4% penetration. Bangladesh? 31.7%. Indonesia comes in at 43.1%.
Millions of people are getting online for the first time. Internet costs keep dropping. More phones. Better networks. Rising incomes.
You're looking at massive populations waking up to digital access.
The math is simple. India has over a billion people. Even at 27.4%, that's a huge user base. Now imagine doubling it. Countries with high adoption rates already maxed out. Growth there? Slow and expensive.
This is where the next wave happens. Not in saturated markets fighting over the same users. In places where connectivity is spreading fast and people are hungry for what you're offering.
Fastest-Growing Countries for Facebook Users
Penetration shows you who's already on Facebook. Growth rates tell you where the real action is happening. Right now, emerging economies are picking up speed.
Why? More people own smartphones. Internet access keeps getting better. And digital economies are opening up to millions of new users.
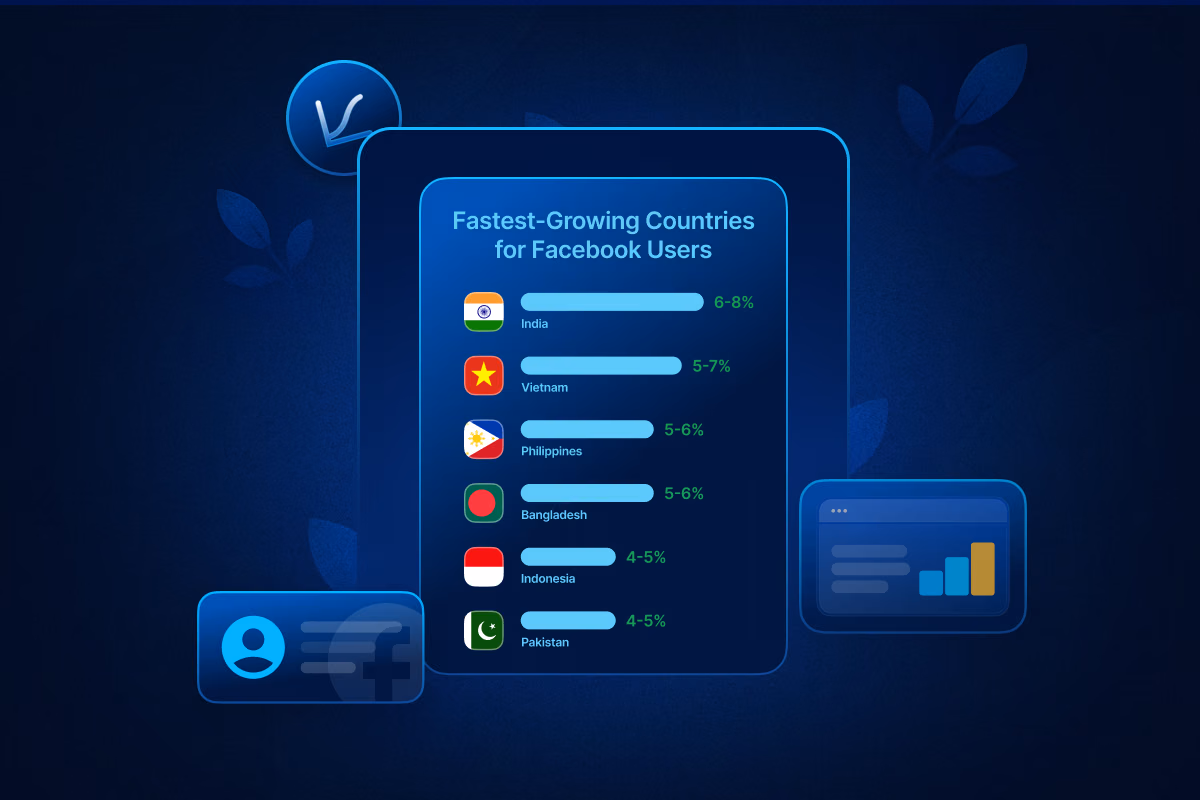
- India leads the pack at 6–8% growth each year. Vietnam follows at 5–7%.
- The Philippines and Bangladesh both clock in at 5–6%.
- Indonesia and Pakistan round out the list at 4–5%.
Mobile phones are changing everything. People who never had internet before are jumping online.
Facebook User Purpose
Facebook is immensely popular for multiple reasons. It is easily agreeable that Facebook can be used as a multipurpose platform, fulfilling needs from advertising to casual use. Some of the most common reasons social media users opt for Facebook are:
Facebook Users by Age Group
User demographics by age illustrate generational preferences and platform maturity. Distribution reveals which cohorts dominate engagement and which segments are diminishing.
Facebook User Distribution by Age
Let's take a look at Facebook user distribution by age:
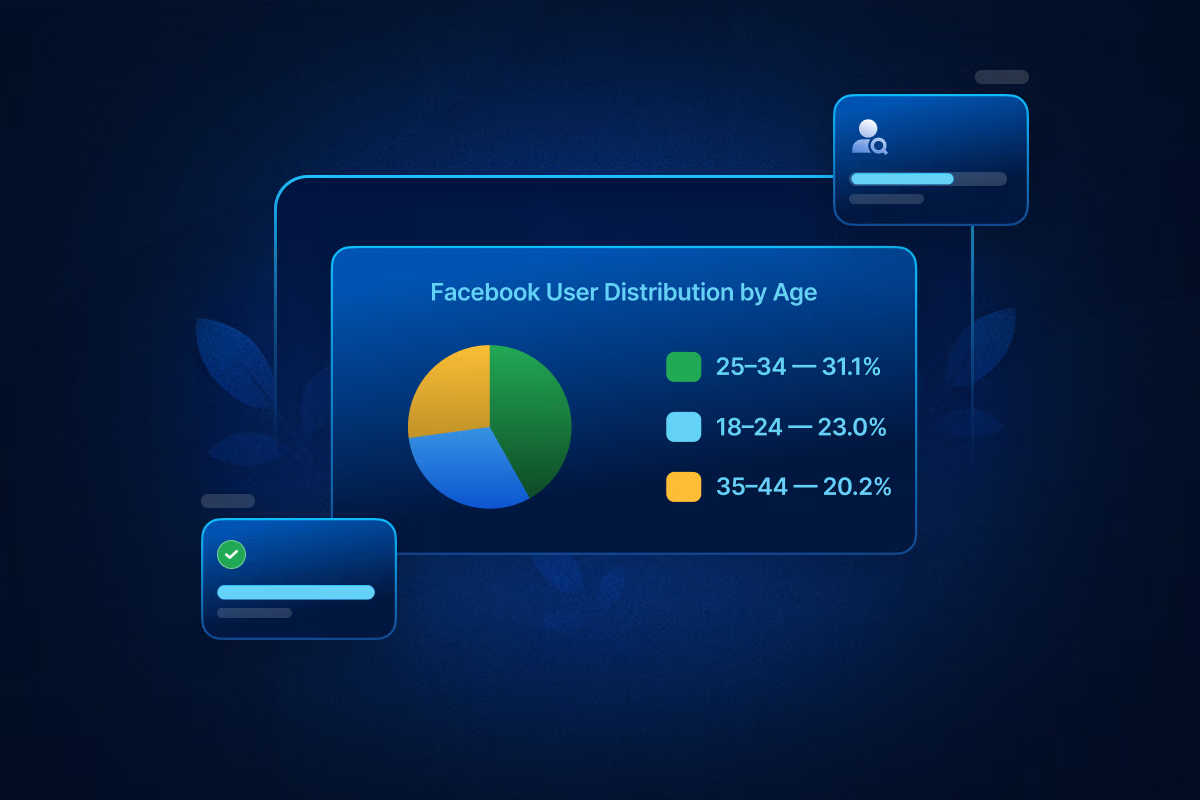
These three segments collectively represent 74.3% of global Facebook users.
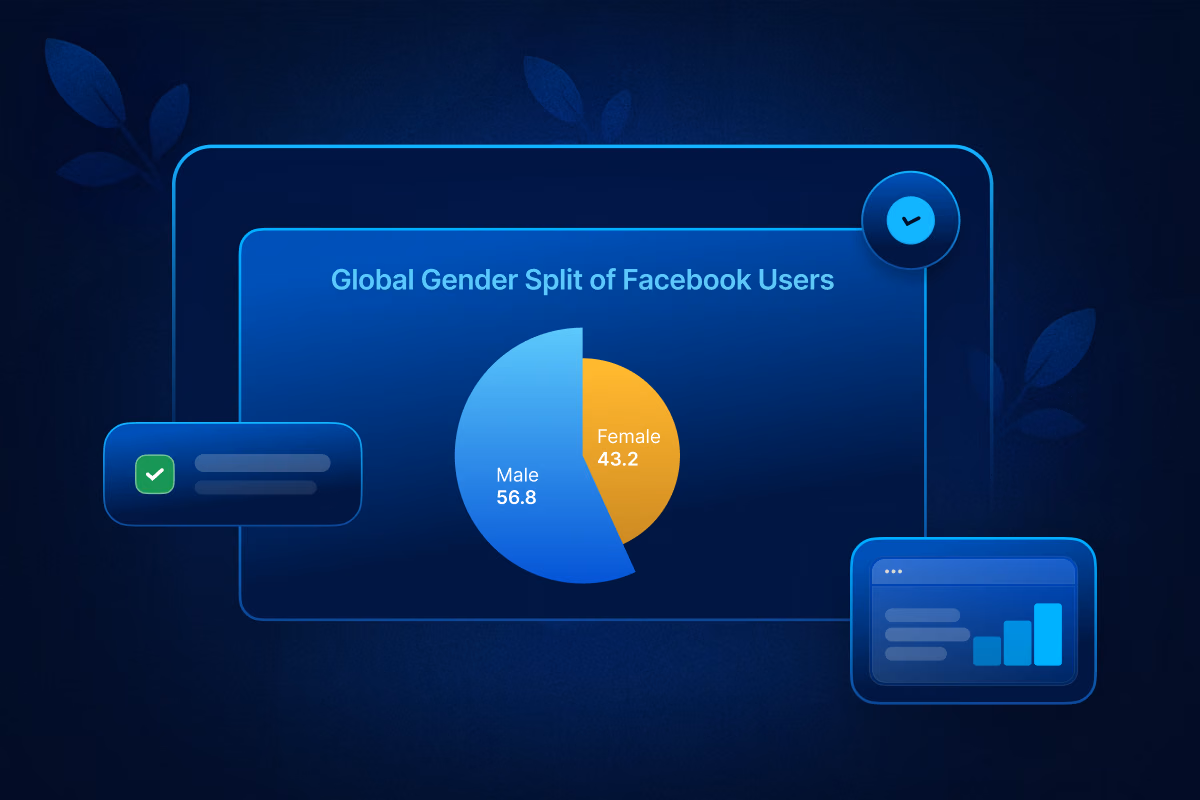
Facebook Users by Gender
Gender distribution provides insight into global audience composition and engagement patterns across regions.
Global Gender Split of Facebook Users
Gender Distribution by Region
Regional variance reflects differing adoption patterns, cultural dynamics, and digital access trends.
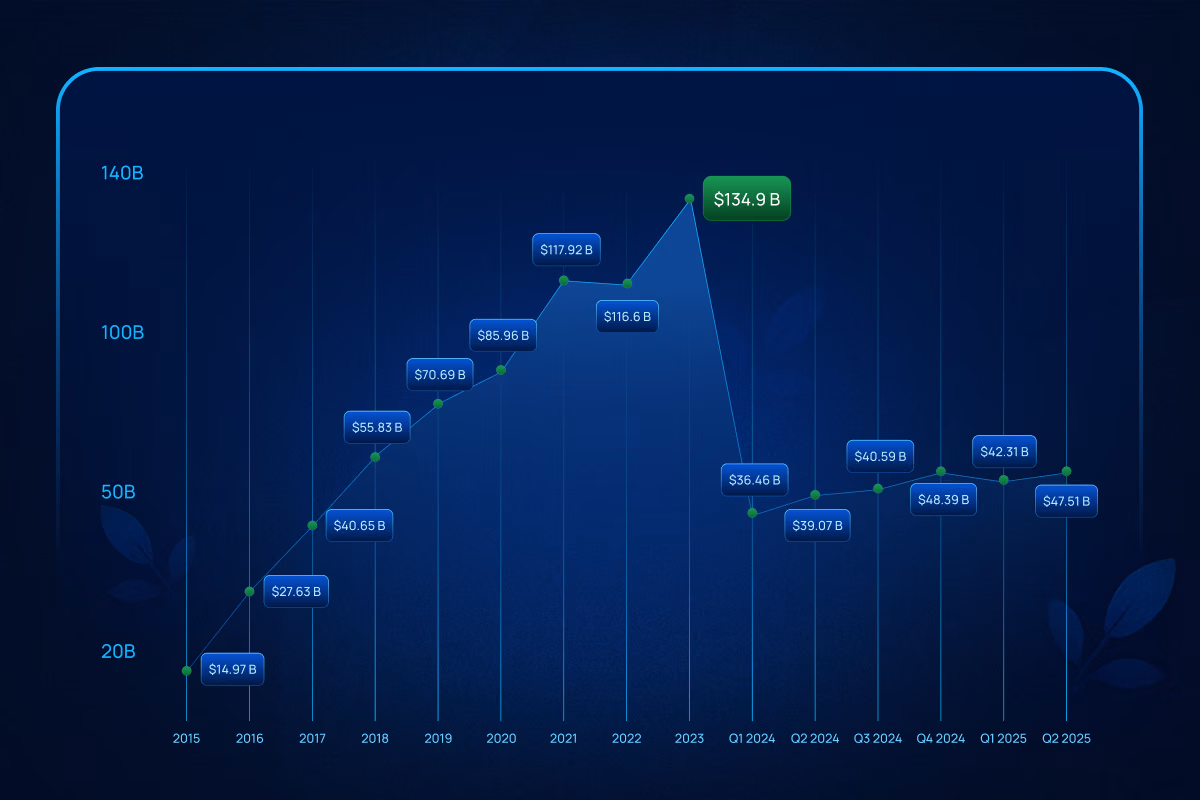
Meta’s Revenue Trajectory
Meta has maintained strong financial momentum into 2025, building on a record-breaking previous year. In the first half of 2025 alone, the company reported a total revenue of $89.82 billion. This is broken down into $42.31 billion from the first quarter and a stronger $47.51 billion in the second quarter, signaling continued growth as the year progresses.
This performance follows a stellar 2024, where Meta achieved an annual revenue of $164.51 billion, marking a 21.94% year-over-year increase. The consistency in quarterly growth suggests that Meta’s ad machinery and family of apps are successfully navigating current market conditions.
Facebook Revenue Breakdown
The graph below tracks Meta's revenue journey from 2015 through the first half of 2025, highlighting the scale of its financial acceleration.
Average Revenue Per User (ARPU): The Regional Divide
While total revenue numbers are impressive, the "Average Revenue Per User" (ARPU) metric reveals where that money is actually coming from. As of Q4 2023, Facebook’s global ARPU stood at $13.12.
However, this global average masks a massive disparity between regions. A user in North America is currently over 12 times more valuable to Meta than a user in the Asia-Pacific region. This gap highlights why Meta continues to focus heavily on monetizing Western markets even as user growth saturates there.
_%20The%20Regional%20Divide.avif)
Facebook User Growth Over Time
The growth of Facebook reflects one of the fastest expansions in digital history. From a small university networking site to a platform connecting billions of people, its trajectory highlights how social media reshaped global communication, business, and online culture.
Facebook User Growth (Year-by-Year)
Tracking year-by-year milestones reveals not only user growth but also key turning points that changed the internet landscape.
.avif)
Facebook grew fast in its early days. Really fast. Between 2008 and 2012, hundreds of millions of people joined the platform. Social networking was taking off, and everyone wanted in.
But things change. Facebook still grows today, just not at that crazy speed anymore. New users keep signing up each year. The numbers go up. Just slower now. Most people who want Facebook already have it.
Major Inflection Points
- 2012 — First platform to surpass 1 billion users
- 2017 — Global scale achieved at 2 billion users
- 2023 — Entry into the 3 billion user era
Is Facebook Still Growing or Declining?
Facebook is still growing overall, but the nature of its growth has changed. Instead of rapid expansion in highly connected nations, user increases now come primarily from developing economies where digital access is still expanding.
Mature Markets
Most people in mature markets already use Facebook. That's just the reality. Growth has hit a wall because there aren't many new users left to reach.
United States : Holding steady
User numbers stay strong. But adding more people? Not happening much. Facebook now works on keeping users engaged and making ads smarter.
United Kingdom : Flat line
Pretty much everyone who wanted to join has joined. The market is full. Activity stays steady but nothing dramatic happens.
Germany: Barely moving
People worry about privacy here. They also have other platforms they like better. So Facebook grows slowly.
Facebook still gets plenty of use in these places. But the company won't win by chasing new users. They need to make the experience better for people already there.
Emerging Markets
Facebook's growth story has shifted. Most new users now come from emerging markets.
Why? More people can afford smartphones. Mobile networks reach further than ever before. Internet access keeps getting better and cheaper.
India keeps growing
Over a billion people live there. More of them get online every day. That's a big deal for Facebook.
Indonesia stays steady
People there use mobile phones for everything. Facebook fits right into their daily routine.
Philippines moves fast
Filipinos love social media. They're glued to their phones. New users keep signing up.
These three countries matter for Facebook's future. Millions of people join the platform every year. And they're just getting started.
Overall Trend
The global picture shows a clear pattern:
- Facebook’s total user base continues to increase worldwide.
- The rate of growth is gradually slowing as key markets reach saturation.
- Most new users now come from developing economies with expanding internet access.
Facebook Users vs Other Social Media Platforms
New apps pop up and grow fast. But Facebook? It still has more users than anyone else on the planet.
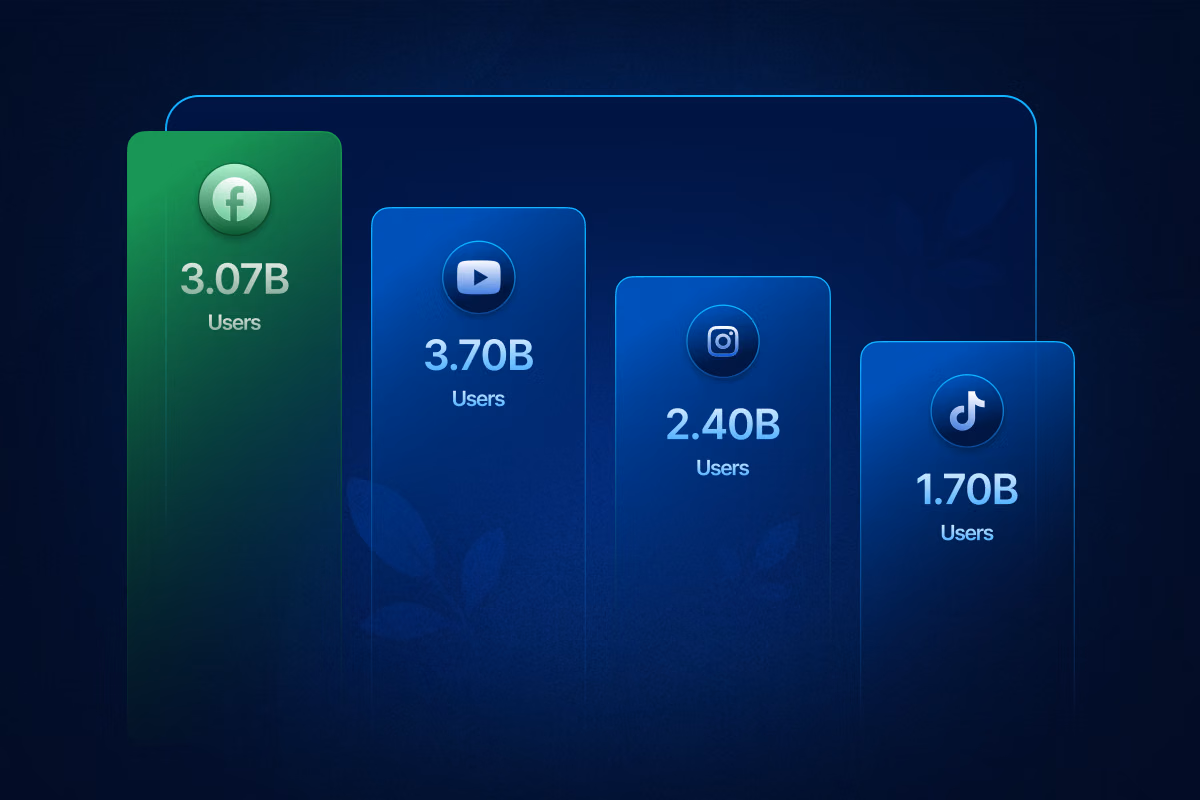
Facebook Users Compared to Instagram, TikTok, and YouTube
Social media platforms fight for your attention. They all want you to stay longer, click more, and share with friends. But people use each platform differently.
Some scroll through photos. Others watch videos or chat with groups.
Global Users Comparison
Facebook’s Share of Global Social Media Users
In 2026, global social media users worldwide reached approximately 5.17 billion people. This means a significant portion of the world’s online population actively uses at least one social platform.
Market Share by Platform (User Share %)
Most people don't stick to just one app.
You probably have Facebook, Instagram, and maybe TikTok on your phone right now. You check Facebook for family updates. You scroll Instagram for photos. You watch TikTok when you're bored.
That's how everyone uses social media these days. We hop between apps like we're channel surfing. One platform can't do everything we want, so we use several.
Facebook as a Favorite Social Media Platform
Along with its immense popularity, Facebook also became the preferred platform for many social media users around the world. Facebook comes in 3rd, with up to 13% active social media users saying Facebook is their favorite social media platform.
Favorite social media platforms
Facebook User Behavior Statistics
User behavior metrics show you what people actually do on your platform.
How long do they stick around? Do they come back? What buttons do they click?
Average Time Spent on Facebook per User
Now let's take a look at how much average time each user spends on Facebook.
Daily Usage Time
On a daily basis, minutes spent per user per day have slightly decreased since 2024:
Billions still use the platform, but they're not sticking around as long as they used to.
Why? Short-form video apps are stealing attention.
TikTok, Reels, YouTube Shorts—they're all fighting for the same eyeballs. And they're winning some of that time.
The numbers tell an interesting story:
- Users open Facebook about 17 times a day
- Each visit lasts around 3 minutes and 42 seconds
Think about that. You're checking Facebook 17 times daily, but only for quick peeks. You open it while waiting in line. You scroll during commercial breaks. You refresh it between meetings.
Most people aren't settling in for marathon scrolling sessions anymore. They're popping in, checking notifications, maybe liking a post or two, then moving on.
It's become a habit; quick hits throughout the day instead of long stretches of browsing.
Facebook usage peak times
Facebook users show up online almost at all hours throughout the day. There will always be someone online at every minute of every day. However, there are certain times of day where most people come online and start scrolling. These are the peak times, and they are actually quite important.
Keeping track of peak usage times helps you know when to post to get the most engagement. It also helps to improve your ad performance and gives you an overall idea of when people are actually scrolling through their feeds.
Facebook Engagement Benchmarks
Understanding what content actually moves the needle on Facebook is crucial for your 2025 strategy. This metric is vital because it measures the quality of your content among the people who actually see it, rather than just your total follower count.
Contrary to the popular belief that video is the only format that matters, the data reveals a surprising hierarchy in engagement efficiency. Here is how the different post types stack up when measuring engagement vs. reach:
If your goal is conversion or traffic, link posts are performing exceptionally well relative to the people they reach. They may not go viral, but they engage the right audience.
Do not judge your Reels solely by engagement rate. A 0.95% rate is standard because the reach is often exponentially higher than other formats. Use Reels for brand awareness (reach) and Video/Link posts for community depth (engagement).
The high performance of Album Posts (1.80%) suggests audiences enjoy swiping through content. Consider turning a single photo post into a mini-gallery to boost interaction.
Engagement by Audience Size
One of the most common pitfalls in social media analytics is comparing a startup brand to a global giant. As your page grows, your engagement dynamics shift drastically.
The February 2025 data from Socialinsider breaks down engagement rates by page size, revealing a distinct trade-off between community intimacy and content efficiency.
Moving from a small page (<10k) to a large one (>100k) typically sees this metric drop from 0.30% to 0.08%. This is a natural consequence of having a larger, more passive audience.
Interestingly, the largest pages have the highest engagement rate relative to Reach (2.20%). This suggests that while fewer of their followers see the content, the content they do put out is highly polished and resonates strongly with the algorithm-selected audience.
If you have fewer than 10k fans, your superpower is your 0.30% follower engagement rate. You are 3.75x more likely to get a reaction from a follower than a massive brand is.
Facebook Users for Advertising & Marketing
Facebook’s immense user base forms one of the largest advertising ecosystems globally. However, the advertising audience differs from overall platform usage metrics. Looking at the latest Facebook ads statistics can give you a bird’s eye view of the Facebook ad market and how to navigate it.
Total Addressable Facebook Ad Audience
- Total potential ad reach: 2.28 billion users
- Ad reach as % of MAU: 74.3%
- Monthly Active Users: 3.07 billion users
Ad Manager estimates fluctuate depending on targeting criteria and geographic filters.
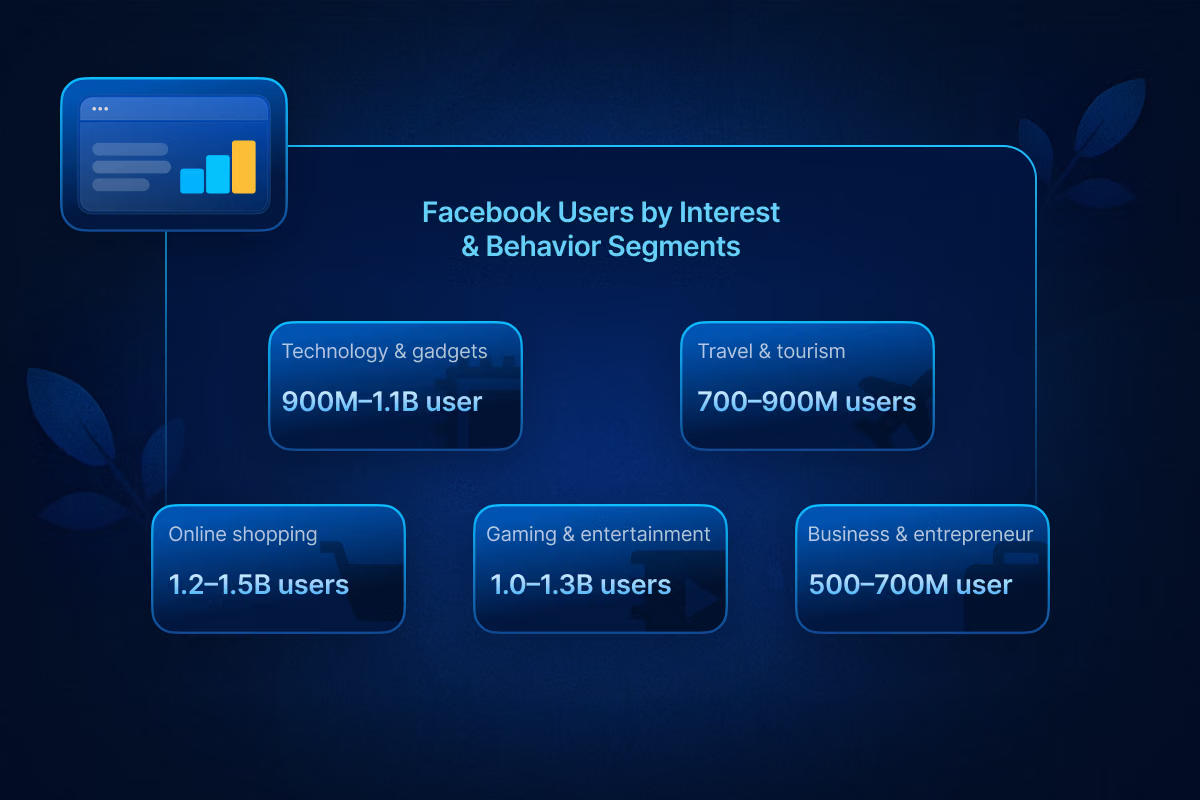
Facebook Users by Interest & Behavior Segments
Audience size varies based on targeting specificity and location filters.
The following infographic describes the behavior segments of Facebook users:
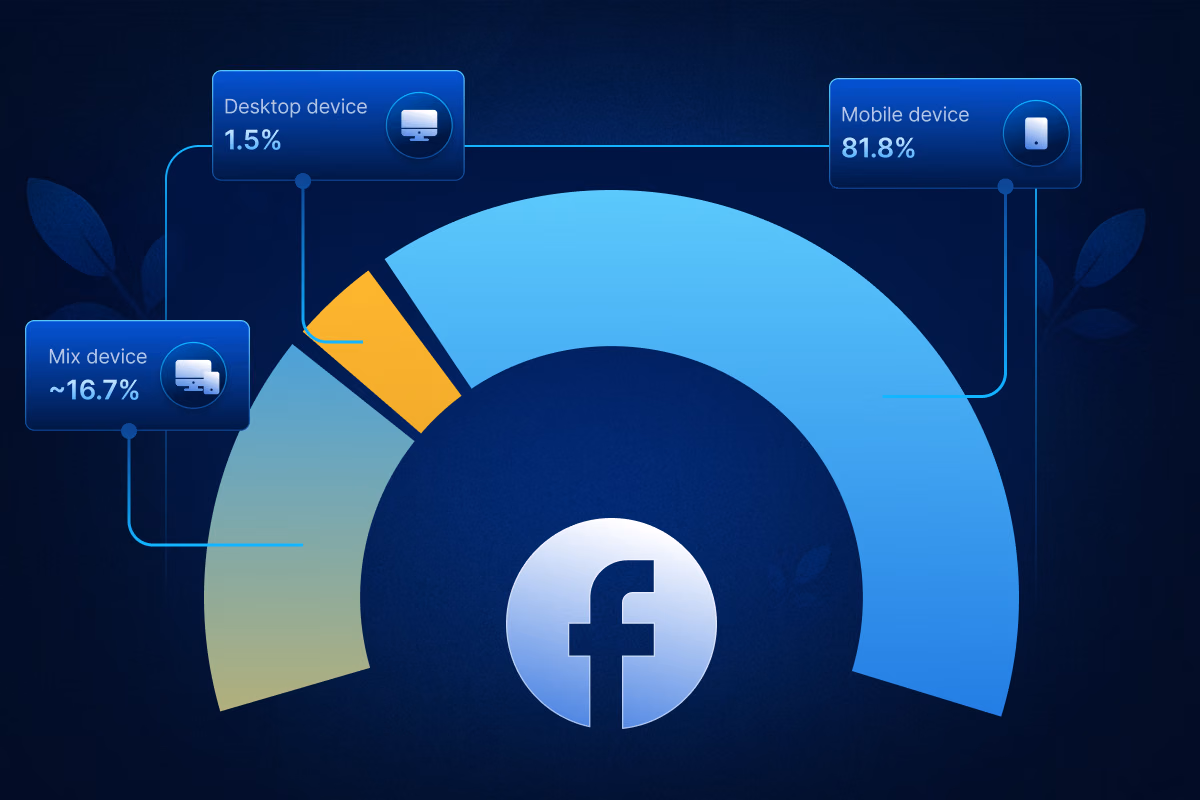
Facebook Users by Device & Platform
Device usage patterns demonstrate how users access Facebook and which interfaces dominate engagement.
Mobile vs Desktop Facebook Users
Most users access Facebook through smartphones, supported by expanding mobile internet infrastructure.
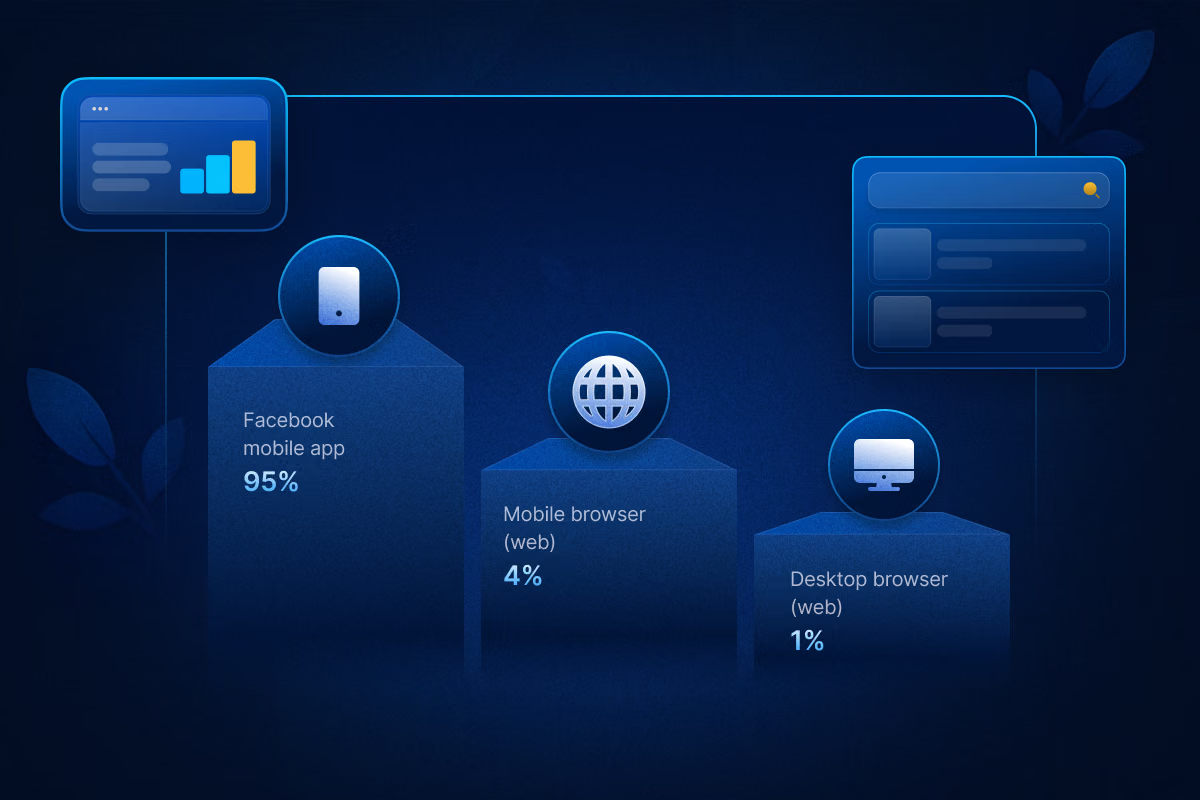
Facebook App vs Web Usage
The native mobile application remains the primary gateway for Facebook interaction globally.
Facebook User Privacy & Account Statistics
Meta currently has 74,067 full-time employees. Concerns surrounding data integrity, privacy safeguards, and account authenticity remain central to discussions about Facebook. Platform disclosures regularly address duplicate accounts, policy enforcement, and user retention dynamics.
Number of Fake or Duplicate Facebook Accounts
Meta’s transparency reports provide periodic estimates of inauthentic activity across the platform.
Fake or Duplicate Accounts (2026 Estimates)
- Fake or duplicate accounts: 4–5% of Monthly Active Users
- Estimated fake accounts: 123–154 million accounts (based on 3.07 billion MAU)
- Primary sources: duplicate accounts, spam accounts, automated accounts
These estimates fluctuate due to ongoing detection, removal, and account verification processes conducted by Meta Platforms.
Facebook Account Retention Indicators
Temporary account suspension or deactivation is significantly more common than permanent deletion.
Conclusion
While the metrics clearly chart Facebook’s ongoing dominance, a colossal 3.07 billion MAU and engagement intensity that few rivals can match, these statistics ultimately point to something far more fundamental: opportunity. This enduring platform is not simply a repository of users; it is a continuously evolving, highly segmented digital economy where potential customers gather in massive numbers.
For marketers and businesses seeking to navigate this intricate global landscape and capitalize on the platform’s resilient reach, the efficiency of execution is paramount. To truly unlock the potential hidden within these billions of users, scaling effective campaigns requires precision tooling and infrastructure designed for modern scale.
This is where specialized support becomes invaluable. Consider leveraging the reliability and proven performance of high-limit Facebook agency ad accounts from Uproas to ensure your strategy isn't bottlenecked by account limitations, transforming this statistical dominance into tangible business growth.
These accounts allow limitless spending, low wait times, and fewer bans and restrictions, promising a smoother campaign experience for your brand. You will also be helped 24/7 by the customer support and get access to advertising across any vertical.
Frequently Asked Questions


Latest blogs
Bing Ads Cost in 2026: Everything You Need to Know
Stop wasting money on ad spend. See the 2026 Bing Ads cost benchmarks, real industry CPAs, and hidden ROI data you need to outperform competitors.

6 Best AI UGC Video Creators for TikTok Ads in 2026
Avoid expensive creators. Find the 6 best AI UGC video platforms for TikTok ads in 2026. Cut production costs, test faster, and scale your ROI.
TikTok Ads Statistics 2026: Benchmarks, Rates and Performance Data
With 8.7M businesses competing, discover key TikTok ads statistics and different benchmarks to beat the competition and refine your ad performance.
Static vs Dynamic Ads: Key Differences, Examples & How to Choose in 2026
Compare static and dynamic ads, their key differences, examples, and when to use each format to improve targeting, conversions, and ROI in 2026.
Geographic Segmentation: Definition, Variables, Examples & How Marketers Use It
Stop wasting ad spend on guesswork. Geographic segmentation uses location data to reach the right audience at the right place and drive real ROI.
How to Manage Multiple Facebook Accounts on One Device
Learn how to manage multiple Facebook accounts on one device safely using browser isolation, account separation, AdsPower, and Uproas tools.

Bing vs Google Ads: Which Advertising Platform Is Better in 2026?
Confused between Bing vs Google ads? Learn the key differences, including cost, reach, and performance. Pick the right ad platform for your business.
7 Best Klaviyo Agencies for Ecommerce Brands in 2026
Looking for a reliable Klaviyo email marketing agency for your ecom business? Here is our list of 7 best Klaviyo agencies for e-commerce you should consider.
.avif)
ROAS Benchmarks: Industry, Platform & Profitability Data (2026 Guide)
Master ROAS benchmarks with this 2026 guide. Get industry, platform (Google, Meta, TikTok, Amazon), and profitability data, plus how to set your own targets.