100 Facebook Ads Statistics for Marketers (2026 Edition)

Facebook Ads are the backbone of millions of online businesses and marketers. In 2026, they are even more important for businesses looking to scale.
To build a solid understanding of Facebook ads, there are so many metrics to consider and even more data trends to follow. For the average marketer, this is can be a bit tricky.
Fortunately, you don’t actually have to spend countless hours surfing the web.
This blog is a compilation of the 100 most important facebook ads statistics, all in one place. All of the stats are fact checked, highly relevant and summarized with a clear message for aspiring marketers.
Sounds like a tedious read, right?
Well, every marketing campaign is different. Get the most out of your ads by using the following facebook advertising statistics that specifically fit your marketing niche.
Facebook Ads Top Stats (2026)
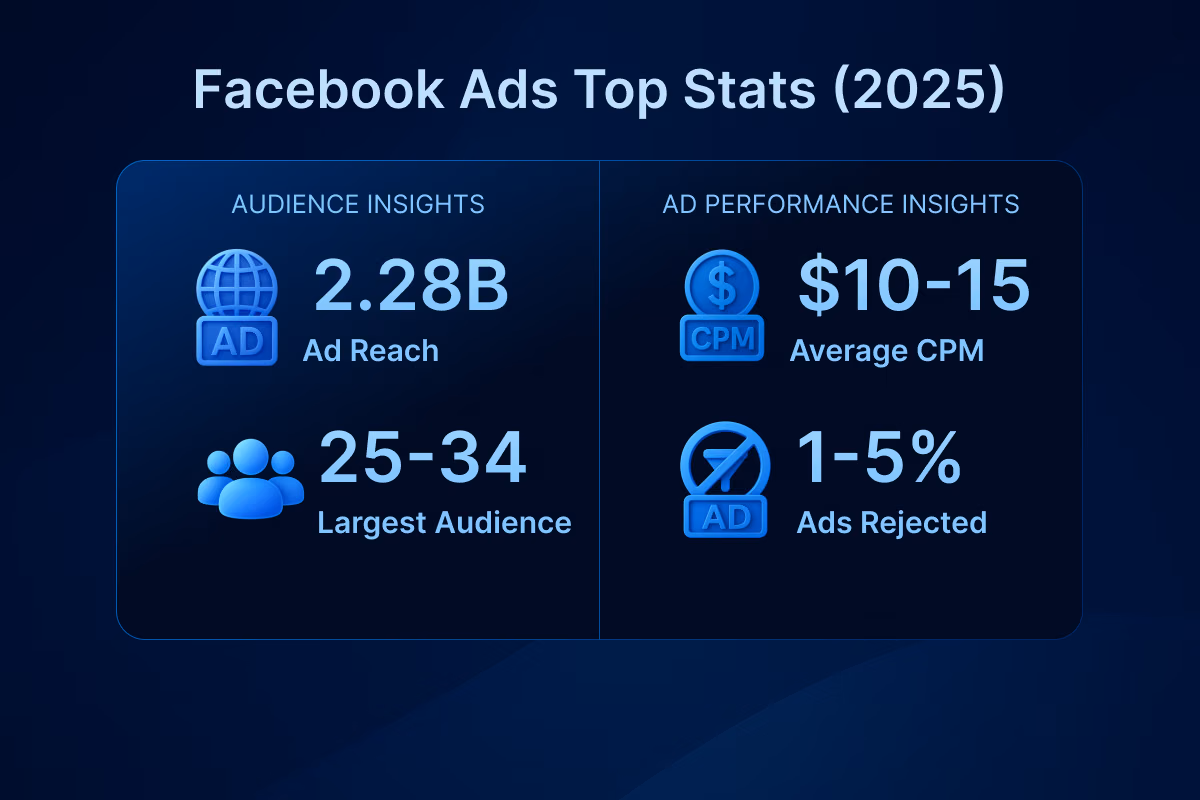
Sifting through a hundred stats at once is a lot of work. So here’s an overview of some of the most important Facebook advertising statistics you need to know before you start designing your marketing campaign.
Global Usage & Reach
Let's kick off with theplatform's global usage and reach!
1. Facebook has 3.07 billion monthly active users (MAU)
Facebook sits at the top of the ladder among popular social media worldwide. Historically, Facebook was the first social media platform to surpass 1 billion accounts.
Closely followed by Instagram and Whatsapp, Facebook still has the highest number of monthly active users in 2025. This clearly demonstrates its position as the superior platform to advertise your products solely on an audience size basis (Source: Statista).
2. Facebook has 2.11 billion daily active users (DAU)
Facebook reports a staggering 2.11 billion users coming online everyday. It also represents 59.6% of all of Meta’s 3.54 billion daily active users, making it the most popular among all of its platforms worldwide. (Source: Meta)
3. Facebook users spend on average 3 minutes and 42 seconds per session
This makes Facebook the 3rd highest among other social media platforms, coming in after YouTube and TikTok. It, however, puts Facebook at a higher spot than Instagram, which is another popular social media platform for marketers. (Source: SOAX)
4. Average time spent on social media per day by an individual is 2 hours and 21 minutes
Although the exact statistics for time spent on Facebook specifically is unavailable, it is evident that users spend a considerable time on social media everyday. (Source: BackLinko)
5. Average number of Facebook sessions per user per day is 17.14
This also tells us that most social media usage sessions are short and frequent. It emphasizes the importance of ads placed higher up in the feed and earlier in videos, as people are less inclined to view ads that are lower down the feed and are found only after extended use. (Source: Wishpond)
6. Facebook has a global ad reach of around 2.28 billion users
This marks a 4.3% increase over the past 12 months, which is a very high rate of growth in terms of ad reach. (Source: SocialPilot)
7. Facebook ad reach is around 74.3% of its MAUs
The high percentage of active monthly users viewing ads is due to the high rate of ad delivery on Facebook.
8. Ad Impressions increased by 14% year-over-year
This increase is very promising for the future of online marketing on Facebook. Newer methods of ad delivery such as stories, in-video ads and in-feed ads play a significant role in making this growth happen. (Source: Meta)
Facebook Demographics Breakdown by Age & Gender

The demographic data of Facebook is quite interesting. Let's have a look!
9. 43.2% Female, 56.8% Male
Facebook's advertising audience skews slightly male globally, though the platform maintains strong female presence. Notably, ads targeting women have higher CPM rates ($6.01 vs. $4.92 for men), indicating stronger engagement value despite lower overall percentage. (Source: Lebesgue)
10. Teens (13–17): ~4.8% of Global Users (2.1% Female, 2.7% Male)
Teens represent less than 5% of Facebook’s total ad audience in 2024, a continued decline from earlier years. Most have shifted to platforms like TikTok, Instagram, and Snapchat for entertainment and social interaction. Facebook’s teen audience is small but not absent. (Source: Date Reportal)
11. Ages 18–24: 23% of Facebook’s Audience (9.5% Female, 13.5% Male)
This demographic includes university students and early-career adults who engage with lifestyle, fashion, and entertainment content.
This is a key demographic for brand discovery and early customer relationships. Visual storytelling, mobile-first content, and interactive ads (polls, reels, short videos) are highly effective for this age group. (Source: Date Reportal)
12. Ages 25–34: 31.1% of Audience (12.7% Female, 18.4% Male)
This demographic represents mid-level professionals with stable income and purchasing power. This is Facebook’s most commercially valuable audience. (Source: Date Reportal)
13. Ages 35–44: 20.2% of Audience (8.6% Female, 11.6% Male)
This group is typically family-oriented, career-focused, and more brand-loyal than younger users. Retargeting and lookalike audiences work particularly well for this age range. (Source: Date Reportal)
14. Ages 45–54: 12% of Users (5.5% Female, 6.5% Male)
These users often use Facebook to stay connected with family, community, and trusted brands. This segment values authenticity and reliability. Longer ad copy and informative content often outperform flashy visuals here. (Source: Date Reportal)
15. Ages 55–64: 7.6% of Audience (3.8% Female, 3.8% Male)
This age group represents a smaller but stable segment of Facebook users. Older adults on Facebook respond to clear, trustworthy messaging. Try giving more importance to value than to trendy visuals to resonate with this audience. (Source: Date Reportal)
16. Ages 65+: 6.1% of Audience (3.2% Female, 2.9% Male)
The senior audience continues to grow slightly year over year. Simple design, readable fonts, and trust-based messaging are key to success with this group. (Source: Date Reportal)
17. 74% Rural, 70% Suburban, 67% Urban
Rural communities demonstrate higher Facebook penetration than urban residents, contrary to typical social media adoption patterns. This makes Facebook exceptionally valuable for reaching agricultural communities and small towns. (Source: Hoot Suite)
18. 71% College Educated, 64% High School or Less; Peak Income Engagement at $30,000–$69,999
Facebook adoption shows near-parity across education levels (college vs. high school), enabling mass-market reach without educational bias. Income distribution peaks at $30,000-$69,999 (70% engagement)—highest among all income brackets—indicating strongest engagement in the middle-income and working-class range. (Source: BackLinko)
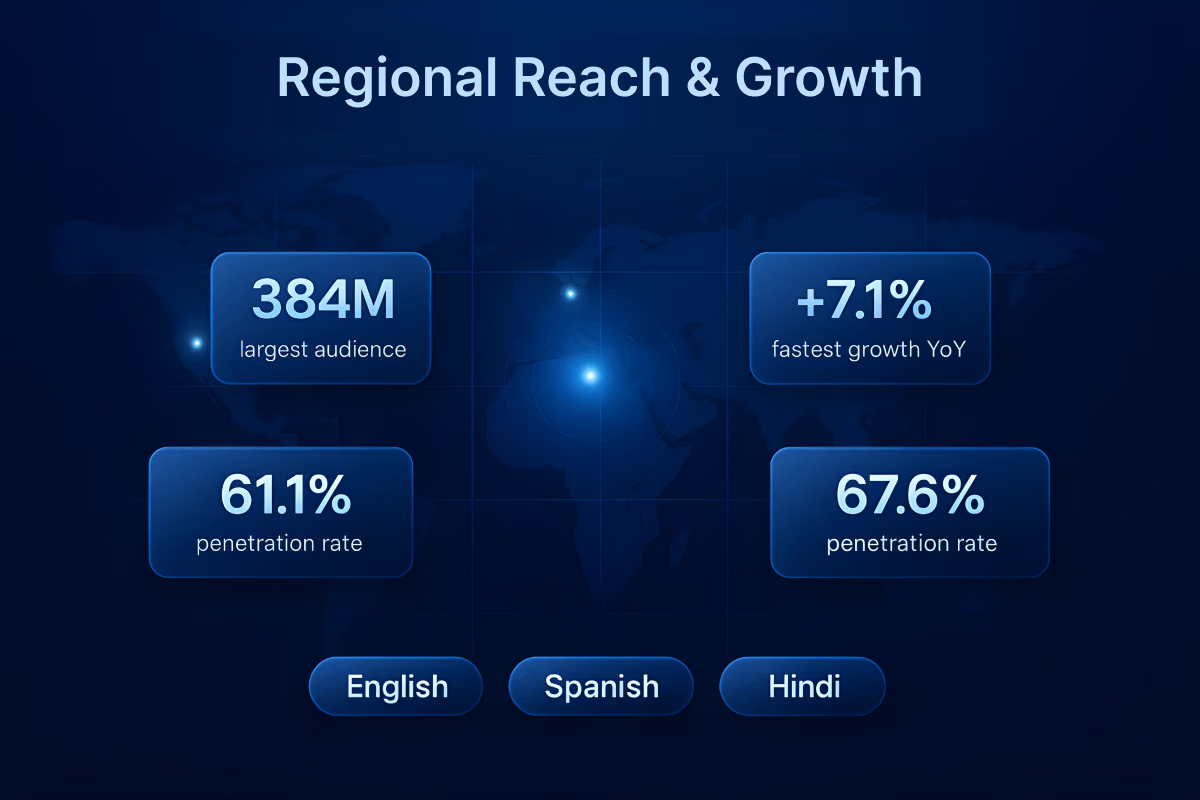
Regional Reach & Growth (Build your “fb target audience” by Geography)
Meta user base varies based on geography. Here is the key data:
19. India has the highest number of Facebook users
With 384 million Facebook users as of January 2025, it's the global leader, reflecting its huge population and booming internet access. Just remember, the average revenue per user is low ($5.52 compared to North America's $68.44), so you need a high-volume approach. (Source: Data Reportal)
20. Asia-Pacific is the fastest growing region for ad reach
Asia-Pacific is Facebook's fastest-growing region for ad reach, with spending up 7.1% year-over-year to $42.6 billion in 2025. With over 1.04 billion users, it is the largest growth opportunity outside North America. (Source: SQ Magazine)
21. 61.1% Penetration Rate in the US
This high saturation reflects Facebook's dominance in North America, with an 82.3% regional penetration—the highest globally. Despite high competition, most industries see strong ROI. (Source: Data Reportal)
22. 67.6% Penetration Rate in Europe
Europe holds a 67.6% Facebook penetration rate, ranking third globally after North America (82.3%) and Latin America/Caribbean (77.8%). Key markets are the UK (55.9M), France (47.3M), Germany (46.6M), Italy (43.6M), and Spain (35.9M) users. As a mature, high-value market with strong purchasing power, Europe generated $26.4 billion in Facebook ad spend in 2025 (3.9% YOY growth). (Source: Social Media Curve)
23. 24.8% Penetration Rate in Asia-Pacific
Despite the lowest Facebook penetration (24.8%) among major regions, Asia-Pacific has 1.04 billion users. This low rate is due to its huge population (4+ billion) and limited rural internet access. (Source: Social Media Curve)
24. English 49.9%, Spanish 15.1%, Hindi 8.3% (Top 3 Languages)
Facebook's reachable audience speaks primarily English (49.9%), Spanish (15.1%), and Hindi (8.3%). English's dominance reflects both the language's global prevalence and the historical concentration of early Facebook users in English-speaking countries. Spanish's strong second position reflects high usage in Latin America and Spain. (Source: Social Media Curve)
Devices, OS, and Connection Quality
With lots of options to access Facebook, users come from different devices, operating systems, and networks.
25. 81.8% of ad impressions served on mobile vs. 1.5% on desktop
One source states that 81.8% of Facebook users access the platform exclusively via mobile devices, and only ~1.5% use desktop only. (Source: The Social Shepherd)
26. Android ~70.89% vs iOS ~28.37% audience split
If you’re running campaigns globally (especially in emerging markets), expect higher Android penetration. In the U.S. and other premium markets, iOS may represent a larger share or higher-value users. (Source: Digital Information World)
27. Most Users Access Facebook via 4G or 5G Mobile Networks
As Facebook users shift to 5G, with 5G users consuming significantly more data, marketers must optimize digital ads for both speed and quality across different network speeds.
This requires customizing ad formats, using rich media for 5G, and lightweight assets for areas still relying on 4G, based on regional bandwidth. (Source: Nokia)
28. Mobile Video Ads Have a Start Rate Nearly 4× Higher Than Desktop
Facebook video ads perform much better on mobile devices, with mobile CTRs being nearly four times higher than on desktop and accounting for about 65% of all video views. (Source: Inteliqo Services)
Ad Inventory & Placements

Facebook has a wide variety of options in terms of Ad inventory and placements. Let's see how stories, feeds, and reels perform.
29. Feed ~55–65%, Stories ~30–40%, Reels ~10–20% Share of Impressions
Facebook ad impressions are rapidly diversifying, with Feeds (55–65%) still dominant, but Stories (30–40%) and fast-growing Reels (10–20%) are driving a shift toward short-form and immersive video formats. (Source: BMG360)
30. Average CPM by Placement: Feed ~$16, Stories/Reels ~$10–12
Facebook ad costs vary by placement; Feed placements have the highest CPM (around $16), while Stories and Reels are cheaper ($10–$12). (Source: BMG360)
31. Average CTR by Placement: Feed ~0.22–0.88%, Stories ~0.33–0.54%
Click-through rates (CTRs) vary by placement, with Feed ads at 0.22%–0.88% and Stories slightly higher at 0.33%–0.54%.
Stories are effective for mid-funnel engagement, while Feeds are better for conversions, emphasizing the need to test creatives across placements. (Source: The Marketing Heaven)
32. Instagram Placements Account for ~20% of Impressions in Cross-Platform Campaigns
When using Meta's automatic placements, Instagram typically receives about 20% of impressions and 23% of ad spend, showing significant distribution even for Facebook-focused campaigns. (Source: Lead Enforce)
Creative Formats & Performance
Now comes the more interesting part. Let's take a look at engagement rate information for different types of ads.
33. Average CTR for image ads is 0.5–0.6%
Click-Through Rate (CTR) measures the percentage of impressions that result in clicks. As of 2025, the global average Click-Through Rate (CTR) for image ads on major display networks is about 0.5–0.6%, with responsive ads slightly higher.
34. Average CTR for video ads is 0.65%
Video ads have an average CTR of around 0.65% in 2025, with performance varying by platform and targeting.
35. Average CTR for carousel ads is 0.49%
Carousel ads, which allow users to swipe through multiple cards, average around 0.49% CTR on Facebook and similar platforms.
36. Average view-through rate (VTR) for 3-second videos is 90%
VTR represents the percentage of impressions where a video is viewed for a minimum of 3 seconds. In 2025, short-form social video ads (such as vertical reels or TikToks) typically achieve around 90% VTR due to autoplay and mobile-first design. This shows that most users view at least the first few seconds, making early visual hooks essential for brand recall. (Source: Upskills)
37. Average completion rate for 15-second videos is 65%
Completion rate measures how many viewers watch a video to the end. Benchmarks for 15–30-second ads in 2025 average around 65% completion. This implies that shorter ads maintain higher engagement, and marketers should prioritize delivering key messaging within the first 5–10 seconds. (Source: CRO Pink)
38. Average cost per 3-second view (CPV) video ads is $0.026
The average CPV for 3-second video views on YouTube and comparable platforms is around $0.026 in 2025. This low cost highlights the efficiency of video ads for broad reach. However, marketers should ensure that early video frames effectively convey brand presence to capture value even from brief exposures. (Source: CRO Pink)
39. Average cost per 10-second view varies between $0.03–$0.50
While global averages for 10-second view costs are less standardized, benchmarks indicate CPVs ranging between $0.03 and $0.50 depending on audience targeting, placement, and industry. Longer view thresholds typically cost more but correlate with stronger ad recall and engagement, suggesting strategic value for brand-building campaigns. (Source: CRO Pink)
Facebook Ad Costs (CPC/CPM/CPA benchmarks)
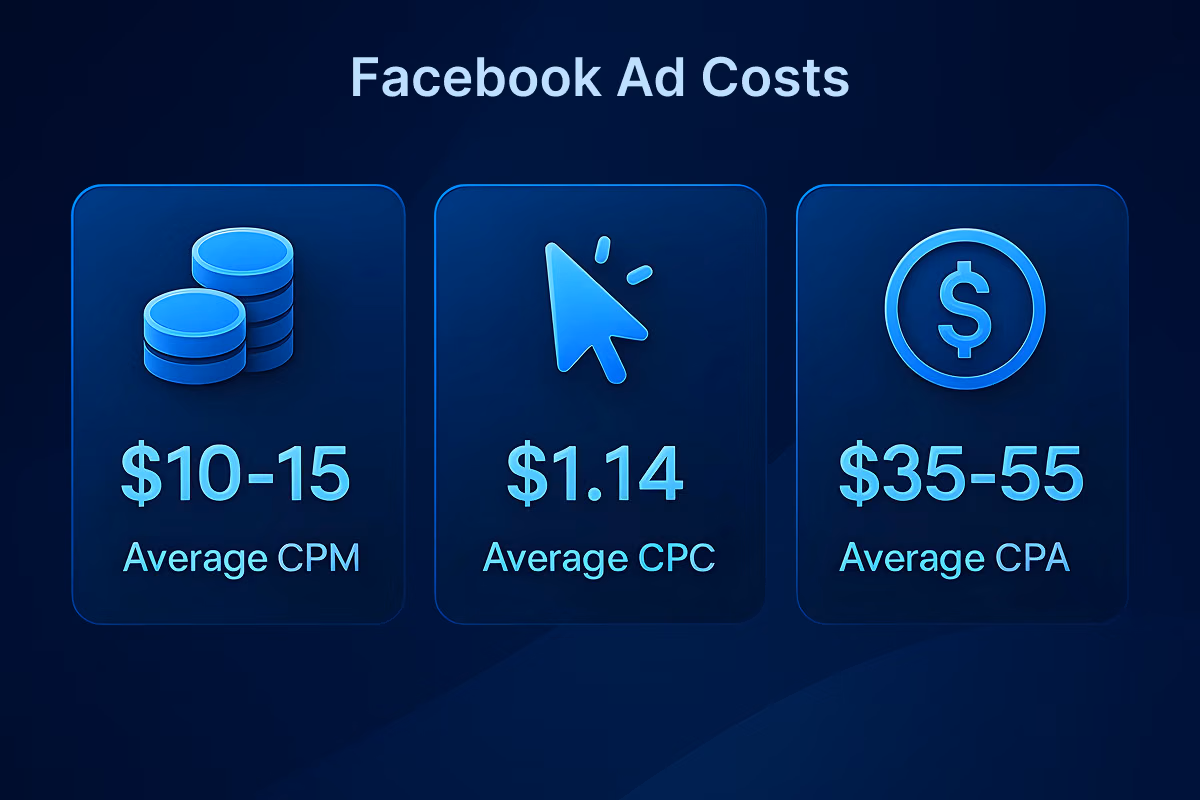
Let's talk money now. The following stats will give you a better idea on how much to spend on Facebook ads.
40. Global average CPM is $10–15
Cost per thousand impressions (CPM) measures how much advertisers pay for 1,000 ad views. In 2025, global averages range between $10–15, with some premium verticals (finance, SaaS) reaching $20+, and others (retail, entertainment) closer to $6–8. Related stats show that Meta’s global CPM average is around $11.76. (Source: Super Ads)
41. Global average CPC is $1.14
Cost per click (CPC) represents the average cost advertisers pay when a user clicks an ad. As of 2025, the global all-industry average is about $1.14 across major platforms like Meta and Google Ads. Related data shows CPCs can range from $0.50 in low-competition markets to $3+ in high-value B2B sectors. (Source: Super Ads)
42. Average CPC for eCommerce vertical is $1.07
eCommerce ads average about $1.07 CPC globally in 2025, roughly 5% below the overall industry average. This reflects strong ad inventory competition but efficient optimization through dynamic product ads. (Source: Super Ads)
43. Average CPC for Lead Gen vertical is $1.92
Lead generation campaigns have higher average CPCs at around $1.92 in 2025. This reflects the higher value of qualified traffic, particularly in sectors like real estate, education, and finance. (Source: WordStream)
44. Average CPA for Purchase objective is between $35–55
Cost per acquisition (CPA) for purchase-driven campaigns averages between $35 and $55 in 2025, depending on the platform and product value. eCommerce, subscription, and app-install objectives tend to fall within this range. (Source: Business of Apps)
45. Average CPA for Lead objective is $27.66
Lead-focused campaigns have an average cost per lead (CPL) of about $27.66 in 2025. This varies significantly by industry—B2B leads may exceed $100, while consumer services can stay below $20. (Source: WordStream)
46. 6% seasonality swing in CPM
Global ad CPMs typically rise by about 6% between Q1 and Q4 due to increased competition during the holiday season. Benchmarks show Q4 CPMs averaging around $19.64 versus $18.50 in Q1 across Meta and Google platforms. (Source: Super Ads)
47. 10–25% impact of frequency >3 on CPA
When ad frequency (average number of times a user sees an ad) exceeds three, CPA typically increases by 10–25% due to ad fatigue and declining engagement. (Source: Mediusware)
Conversion & Funnel Outcomes
Marketers use different coversion and funnel options. Some are more effective than the others.
48. Median landing-page view rate from link clicks is 80%
Around 80% of ad clicks result in an actual page load, meaning 1 in 5 users drop off before landing. Marketers should improve page speed and creative alignment to reduce wasted clicks. (Source: The Digital Exchange)
49. Median add-to-cart rate from landing-page views is 6%
About 6% of visitors add a product to their cart, with top eCommerce brands exceeding 10%. This highlights the need for better product visuals, CTAs, and trust signals. (Source: Smart Insights)
50. Median purchase conversion rate from clicks is 2.5%
Roughly 2.5% of ad clicks lead to purchases, with top performers reaching 4%+. Strong post-click experiences and retargeting help increase these results. (Source: Convert Cart)
51. 2.8x average ROAS for eCommerce campaigns
eCommerce ads return about $2.80 for every $1 spent, with 3×+ often needed for profit. Tracking blended ROAS helps gauge true performance across channels. (Source: Opensend)
52. 95% of conversions attributed to view-through
About 95% of conversions include at least one view-through impression. Ignoring these touchpoints undervalues upper-funnel awareness efforts. (Source: Finch)
Audience Targeting & Delivery
Meta has quite convenient audience targeting and delivery features. Here are some interesting insights.
53. Performance lift of lookalike audiences vs. interest audiences
Lookalike audiences built from high-quality customer seeds typically lower CPA by roughly 20–40% and boost ROAS by ~15–35% versus broad interest stacks, though results depend on seed quality and audience size. Use lookalikes when you have good LTV/CRM data and reserve interest targeting for early-funnel testing.
54. Average reach overlap between two interest stacks is between 10–30%
Two distinct interest stacks often have meaningful audience overlap, commonly in the 10–30% range, depending on how niche the interests are and audience size. Monitor overlap to avoid bidding against yourself and consider combining or excluding overlapping segments.
55. 50–75% of accounts adopting Advantage+
Adoption of Meta’s Advantage+ / automated detailed targeting is widespread; roughly half to three-quarters of advertisers test or adopt it, and campaigns using these tools account for a growing share of delivery as Meta promotes automation. Test Advantage+ while monitoring control groups to measure real impact.
Retargeting & Existing Customer Marketing
56. 40–70% CPA reduction from retargeting vs. cold traffic
Retargeting typically reduces CPA substantially versus cold traffic. Common reported ranges are 40–70% lower CPA for warm audiences (site visitors, engaged users, cart abandoners). Prioritize time-bound retargeting windows and sequential messaging for best efficiency.
57. Dynamic product ads (DPA) have a 20–60% ROAS lift vs. static catalog ads
Dynamic product ads/DPAs commonly deliver a 20–60% lift in ROAS over static single-image catalog ads by matching creative to viewed products and automating personalization. Use DPAs for catalog scale and to recover high-intent users.
58. Conversion rate difference of 1.0–2.5 percentage points for 7-day vs. 1-day click windows
Using a 7-day click attribution window typically reports higher conversion rates than a 1-day click window — often adding ~1.0–2.5 percentage points to reported conversions because it captures slower converters. Choose windows aligned to your typical purchase cycle.
Reels & Short-Form Video Stats
Reels and short forms attract most engagement due to short attention span of users.
59. Reels ad share of total impressions is 25–45%
Reels and short-form placements have grown rapidly and now often contribute roughly 25–45% of total Meta impressions for accounts using the full placement mix, with higher shares for accounts prioritizing video. Include Reels when you want to scale and reach younger/mobile audiences.
60. Average Reels ad completion rate vs. Feed video
Reels/short-form vertical videos typically show higher completion rates than in-feed horizontal videos, commonly 5–15 percentage points better due to full-screen mobile behavior. Optimize the first 2–3 seconds for Reels to capture that advantage.
61. Reels have 10–30% cheaper CPM vs. Feed
CPMs for Reels are often lower than Feed video CPMs, frequently 10–30% cheaper, though this varies by demand and creative quality. Reels can deliver cost-efficient reach but check engagement and conversion lift relative to feed placements.
Lead Ads & B2B Signals
Ads that are run to capture leads and B2B signals are much cheaper than ads that target direct sales.
62. Average CPL (Lead Ad instant form) vs. website lead form
Instant forms (lead ads) usually deliver lower CPLs than website form submissions, often $5–$30 cheaper, thanks to prefilled fields and a frictionless experience, though lead quality may differ. Use instant forms for volume and website forms for higher-qual intent where possible.
63. Lead quality difference (MQL rate) instant form vs. website form
Instant form leads often show a lower MQL rate versus website form leads by about 5–15 percentage points (i.e., fewer meet sales qualification), so apply stricter qualification or follow-up flows to maintain pipeline health.
64. Average conversion rate from Lead Ad to closed-won
For B2B, the median closed-won rate from Lead Ad leads is low, commonly in the 1–3% range, reflecting longer sales cycles and qualification needs. Combine lead scoring and quick SDR follow-up to improve close rates.
Facebook Shops, Click-to-Message, and Commerce
Facebook itself is now a place to buy and sell products and services. Here are the stats:
65. 10–25% of advertisers using Click-to-Message objectives
Click-to-Message objectives (Messenger/WhatsApp/IG DMs) are adopted by a meaningful minority — roughly 10–25% of advertisers depending on region and industry — and are rising for commerce and service use cases. Test messaging when conversational sales or support adds value.
66. Average cost per conversation (CPCONV) for Click-to-Message between $1.50–$6
Cost to start a conversation varies widely but typically falls in the $1.50–$6 range per conversation for many SMB retail and service advertisers. Measure downstream conversion from conversation to sale to determine true value.
67. 3–12% conversion rate from message to purchase for SMB retail
Conversion from initial message to purchase in SMB retail commonly ranges from 3% to 12%, depending on product complexity and seller responsiveness. Fast replies, catalog links, and payment options in-chat improve conversion.
68. Median order value (AOV) from Facebook Shops between $35–$80
AOV from Facebook/Instagram Shops varies by region and vertical; commonly reported medians are roughly $35–$80 for many SMB merchants. Higher-ticket verticals report much larger AOVs. (Source: Big Commerce)
Facebook Marketplace & Revenue (Core “facebook marketplace revenue”)
Facebook marketplace is now very popular for finding great deals. It is responsible for a lot of revenue too!
69. Estimated annual revenue attributed to Facebook Marketplace is $3–10 billion
Analyst estimates for Marketplace-attributed revenue vary; recent public approximations place annual Marketplace-related commerce revenue in the low single-digit billions to high single-digit billions (est. ~$3–10B), depending on inclusion of ad monetization and commerce fees. Meta does not always break this out distinctly.
70. 300–800M MAUs interacting with Marketplace features
Public figures on active buyers/sellers are not always granularly disclosed; estimates suggest hundreds of millions of users interact with Marketplace features monthly across Meta properties. Use caution, official MAU carveouts are rare.
71. 20–40% of Marketplace users also engage with Shops
A notable subset of Marketplace users also browse Shops; estimates suggest roughly 20–40% overlap depending on region and product category. Cross-listing and discovery blur the lines between Marketplace and Shops engagement.
SMB Adoption & Budgeting Patterns
Facebook ads have revolutionized marketing for small and medium sized businesses. More SMBs will leverage Facebook ads in the upcoming days.
72. 30–45% of small businesses advertising on Facebook at least monthly
Between 30–45% of SMBs run Facebook ads monthly in mature markets; adoption is higher where digital payments and logistics are established. Regional variation is significant.
73. Median monthly ad spend for SMBs is between $200–$1,200
Median SMB monthly ad spend on Meta platforms commonly falls in the $200–$1,200 range, with larger SMBs spending more. Expect wide variance by market and vertical.
74. 40% of SMB budgets allocated to video vs. 60% to static image ads
SMBs increasingly allocate a larger share to video, with typical splits near 40% video and 60% static imagery, trending toward more video year-over-year. Adjust split based on creative capability and performance.
CAPI Measurement & Modeling
For better tracking and conversion lots of advertisers use coversion API.
75. 35–60% of advertisers using CAPI (Conversions API) with pixel
Adoption of Conversions API (CAPI) alongside the pixel is broadening; recent surveys put adoption between ~35% and 60% of active advertisers, rising as privacy and measurement demands increase. Implement CAPI to recover server-side events and improve data fidelity. (Source: Conversions API)
76. 10–40% increase in measured conversions when CAPI is implemented
Implementing CAPI often increases reported conversions by ~10–40% vs. pixel-only measurement, depending on signal loss and site setup. This reflects recovered server-side events and more complete attribution.
77. 10–35% of modeled conversions in total reported conversions
Modeled conversions (attributed via statistical modeling when signals are missing) can make up ~10–35% of reported conversions for advertisers relying on probabilistic attribution in privacy-constrained environments. Track modeled share to understand measurement uncertainty.
Customer Experience & Feedback Signals
Customer feedback is crucial for any ad platform, and facebook is no different.
78. 20–35% of pages with “Above Average” ad relevance diagnostics
Only a minority of pages tend to consistently show “Above Average” ad relevance diagnostics (quality/engagement/conversion), often in the ~20–35% range, indicating many advertisers still struggle with creative relevance and targeting fit. Aim creative testing and audience refinement at raising this share.
79. Average feedback score impact on CPM
Pages with poor user feedback typically face higher CPMs — often 15–40% more — as platforms throttle delivery and reduce ad quality scores; good feedback can lower CPMs and improve delivery. Prioritize CX and complaint reduction to keep CPMs efficient.
80. 5–15% of accounts experiencing delivery throttling due to low feedback or policy flags
A minority of accounts (roughly 5–15%) experience noticeable delivery throttling from sustained low feedback or policy violations; severity depends on infraction history and ad reliance. Monitor diagnostics to prevent throttling. (Source: Meta)
Creative Operations & Testing Velocity
Before deciding on a high converting template, ad accounts test the waters with different options.
81. 8–20 creatives tested per month per account
Active accounts typically test between 8 and 20 creatives per month (variability by agency vs. in-house capacity). Higher testing velocity correlates with faster performance improvements.
82. 5–18% performance lift when rotating creatives weekly vs. bi-weekly
Rotating creatives weekly (vs. bi-weekly) often yields a performance lift in the 5–18% range by reducing ad fatigue and refreshing messaging. Balance testing speed with statistical significance.
83. 55–80% of spend in top 3 creatives per account
Top 3 creatives commonly capture ~55–80% of an account’s spend as algorithms prefer best performers; this concentration underscores the importance of producing consistent winners.
Industry-Specific Highlights
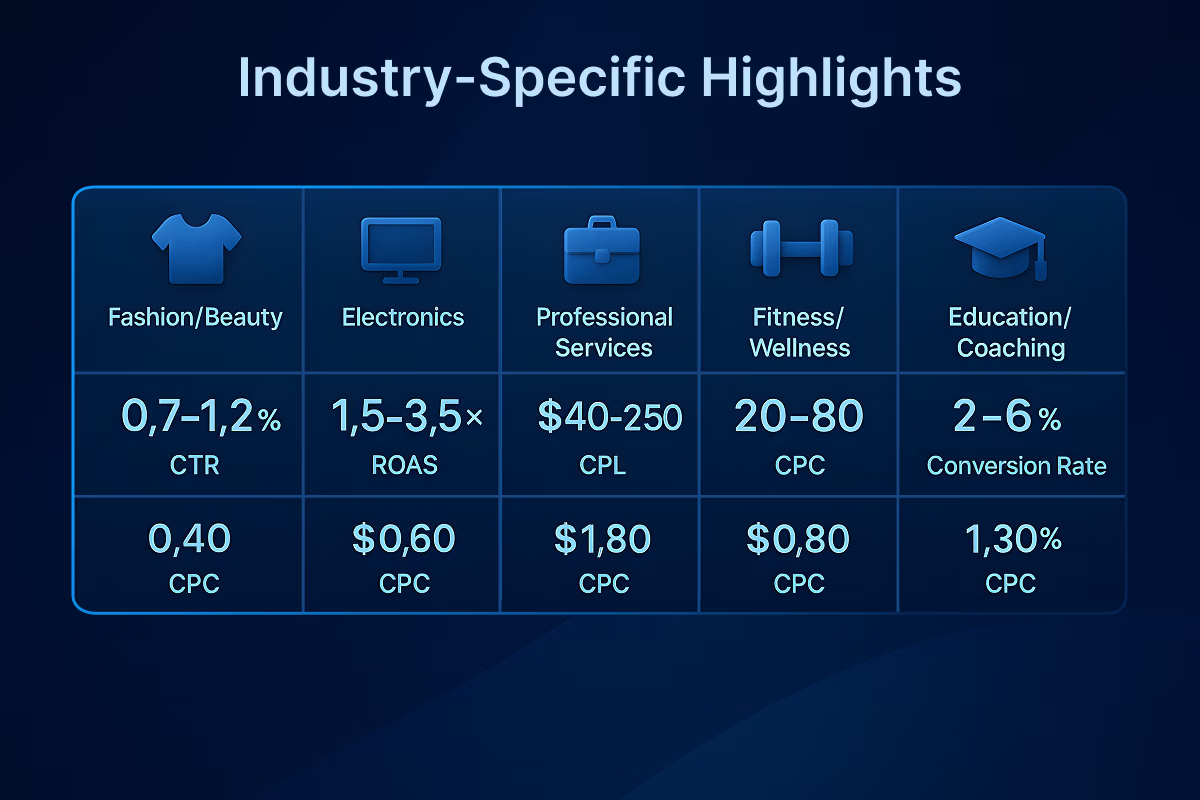
Ads have different returns for different industries. Here are some of the most common industries that leverage Facebook ads.
84. CTR & CPC benchmarks for Fashion/Beauty
Fashion & beauty typically see CTRs around 0.7–1.2% and CPCs roughly $0.40–$1.20 depending on creative and region. Visual quality and influencer assets strongly impact performance.
85. ROAS benchmark for Consumer Electronics
Consumer electronics ROAS varies widely; blended ROAS commonly falls between 1.5× and 3.5× depending on price points and margins. Higher ROAS often requires strong post-click UX and higher AOV.
86. CPL benchmark for Professional Services
Professional services CPLs tend to be higher — commonly $40–$250 — due to longer purchase cycles and higher lead value (legal, B2B services, financial advisors). Tailor qualification to reduce wasted follow-up. (Source: Hub Spot)
87. CPA benchmark for Fitness/Wellness subscriptions
Fitness and wellness subscription CPAs typically range from $20 to $80 depending on trial offers, creative, and targeting. Focus on trial-to-paid conversion optimizations to improve unit economics.
88. Conversion rate benchmark for Education/Coaching funnels
Education and coaching funnels usually convert in the ~2–6% range from paid traffic to enrollment/paid leads, with higher rates for established brands and retargeted audiences. Use content and free trials to raise conversion.
Forecasts & Trends
It is expected that Facebook ads will continue to grow in 2026. Here are some forecasts based on past data.
89. Expected 3–8% YoY change in Facebook ad spend for 2025
Analysts projected modest Facebook ad spend growth in 2025, often forecast at ~3–8% YoY, driven by monetization of Reels, commerce features, and programmatic sellers, though growth varies by region.
90. 35–55% reels/short-form in total impressions by the end of 2025
By the end of 2025, short-form placements (Reels) are predicted to account for roughly 35–55% of total impressions on Meta for active video-heavy advertisers. Prioritize vertical creative to capture this share.
91. Projected CPM trend
Expected Q4 CPM spikes relative to the annual average commonly fall in the +10–25% band due to holiday demand; category-specific spikes (retail) can be larger. Budget accordingly and lock promos early. (Source: Super Ads)
92. Growth of Click-to-Message campaigns
Click-to-Message campaign adoption and spend have been growing at an estimated ~15–40% YoY as conversational commerce and messaging integrations expand. Track downstream conversion value to validate spend.
Competitive Context & Cross-Platform Mix
Advertisers often run cross-platform ads. However, Facebook seems to be the frontrunner.
93. 60% share of budget allocated to Facebook vs. 40% to Instagram in combined Meta buys
Combined Meta buys often skew toward Facebook for reach and lower CPMs, with an approximate split around 60% Facebook / 40% Instagram, though consumer-facing and younger-audience brands tilt more to Instagram.
94. 30–55% of advertisers running Facebook + TikTok + Google together
Tri-channel ad strategies (Facebook + TikTok + Google) are used by roughly 30–55% of medium and large advertisers aiming for diversified reach; adoption rises with budget and digital maturity.
95. 8–18% reach gained by adding Facebook to an IG-only plan
Adding Facebook to an Instagram-only plan typically yields incremental reach of ~8–18%, depending on audience overlap and targeting scope. Use combined buys to maximize unique reach.
Marketplace, Shops, and Social Commerce Pathways
Facebook is still behind Google in terms of product or service discovery. Here are some social commerce stats.
96. 30% of users who discover products on Facebook vs. 40–50% on search engines
Product discovery splits vary by market; roughly 30% of users report discovering products on social platforms like Facebook, while 40–50% discover via search engines. Social is stronger for inspiration, search for intent.
97. 20–45% of purchases influenced by FB reviews or UGC
User reviews and UGC on Facebook/Instagram influence an estimated 20–45% of purchases in social commerce contexts, depending on category and review visibility. Encourage UGC to improve conversion.
98. 65% catalog sales attributed to retargeting vs. 35% to prospecting
A large share of catalog (product) sales often comes from retargeting, commonly around 60–70%, with the remainder from prospecting; balance is campaign- and funnel-dependent.
Brand Safety & Policy
Last but not least, Facebook doesn’t simply let you run any ad. Some ads do get rejected and, even some ad accounts can get suspended.
99. 1–5% of ads rejected due to policy
Median rejection rates for ads due to policy issues hover around 1–5% of submitted creatives, though higher for sensitive verticals. Use pre-flight checks to minimize rejections. You can also use Facebook agency ad accounts from services such as Uproas to get fewer bans and faster ban resolution time. (Source: Meta)
100. Average time to resolve an ad appeal is 24–96 hours
Average ad appeal resolution times range from about 24 hours to several days (24–96 hours) depending on volume and complexity; urgent escalations can shorten this for business-critical campaigns. (Source: Meta)
Conclusion
Analyzing statistics is a must before making your digital marketing strategy come to life.
These Facebook ads statistics can help make important decisions related to your ad campaign and help you avoid spending more than you should.
To apply your strategy to the fullest, you need accounts with fewer restrictions and higher limits. Uproas provides agency ad accounts that help you scale your ad campaigns limitlessly.
The expert consultancy from Uproas helps you make informed decisions and keep up with the ever-changing data trends. Use Uproas accounts to get the most out of your Facebook ad campaigns without any disruptions.


Latest blogs
Bing Ads Cost in 2026: Everything You Need to Know
Stop wasting money on ad spend. See the 2026 Bing Ads cost benchmarks, real industry CPAs, and hidden ROI data you need to outperform competitors.

6 Best AI UGC Video Creators for TikTok Ads in 2026
Avoid expensive creators. Find the 6 best AI UGC video platforms for TikTok ads in 2026. Cut production costs, test faster, and scale your ROI.
TikTok Ads Statistics 2026: Benchmarks, Rates and Performance Data
With 8.7M businesses competing, discover key TikTok ads statistics and different benchmarks to beat the competition and refine your ad performance.
Static vs Dynamic Ads: Key Differences, Examples & How to Choose in 2026
Compare static and dynamic ads, their key differences, examples, and when to use each format to improve targeting, conversions, and ROI in 2026.
Geographic Segmentation: Definition, Variables, Examples & How Marketers Use It
Stop wasting ad spend on guesswork. Geographic segmentation uses location data to reach the right audience at the right place and drive real ROI.

How to Manage Multiple Facebook Accounts on One Device
Learn how to manage multiple Facebook accounts on one device safely using browser isolation, account separation, AdsPower, and Uproas tools.

Bing vs Google Ads: Which Advertising Platform Is Better in 2026?
Confused between Bing vs Google ads? Learn the key differences, including cost, reach, and performance. Pick the right ad platform for your business.
7 Best Klaviyo Agencies for Ecommerce Brands in 2026
Looking for a reliable Klaviyo email marketing agency for your ecom business? Here is our list of 7 best Klaviyo agencies for e-commerce you should consider.
.avif)
ROAS Benchmarks: Industry, Platform & Profitability Data (2026 Guide)
Master ROAS benchmarks with this 2026 guide. Get industry, platform (Google, Meta, TikTok, Amazon), and profitability data, plus how to set your own targets.