
Static vs Dynamic Ads: Key Differences, Examples & How to Choose in 2026

Advertising can be a daunting process, oftentimes requiring you to track a screen full of metrics. Alternatively, using the cost per result formula can help you get a bird’s eye view of your overall ad performance.
There are a number of readily available cost metrics in a typical ad manager platform. These commonly include cost-per-click (CPC), cost-per-thousand impressions (CPM) and cost-per-view (CPV).
The purpose of the plethora of ad cost metrics boils down to how much you ultimately need to spend.
Cost per result is a direct way of measuring how much you are paying to achieve your desired outcome in ads.
In essence, it helps you identify what each desired action is costing you and which ads help you get the results at a cheaper rate.
Tracking your cost per result can help you make important advertising decisions and identify well performing ads and appropriate budgets.
But it needs to be measured following the right method. Otherwise, you risk a false assessment of your ads.
This blog dives into the steps involved in calculating your cost per result and the factors that may influence it.
What Is Cost Per Result?
Every successful advertiser begins with a clear definition of what they want to achieve. Cost per result gives structure to this by showing how much you spend to generate one desired action.
Similar to the conversion rate formula, the meaning of cost per result depends entirely on your campaign objective. For some brands the result might be a click.
For others it could be a purchase, a form submission, a phone call, or a video view. Cost per result reflects the cost of achieving this chosen action and therefore acts as a direct measurement of campaign efficiency.
While metrics like cost per click or cost per thousand impressions show traffic and visibility, they do not show whether your advertising actually produces valuable outcomes.
Cost per result goes deeper by connecting your spending directly to real business results.
When You Should Use CPR
Before you learn the cost per result formula, it’s important to understand why and when to use it.
There are many other metrics that Meta, Google or TikTok usually display on their ad managers. These metrics all have different implications and can be used for a specific purpose.
There are quite a few good reasons to track your CPR. These typically include:
- Can identify well-performing ads: Can help you decide which ad gets your desired outcome for cheaper. On the flipside, also helps you find out which ads are costing you more money.
- Can help in budgeting: CPR can help you decide how much your budget should be for your next ad campaign. You can set achievable targets and allocate an appropriate amount of money for each ad.
- Can help set goals: You can also set engagement and conversion goals based on your CPR from previous similar-looking ads.
- Can help with product pricing: Knowing how much each sale costs through ads can help you set an appropriate price for your products. E-commerce businesses can easily set a price that makes up for the cost of selling it.
- Can help with scaling: If business is going well, you will eventually scale your ad strategy. CPR can help you make scaling decisions and accurate projections of where you may be after an expansion.
Cost per result reflects the true price of achieving your chosen objective, making it one of the most important tools for budgeting, forecasting, and scaling.
The Cost Per Result Formula (Simple Breakdown)

To understand the power of cost per result, it helps to begin with the basic formula.
Cost Per Result equals the total amount spent divided by the total number of results.
Now, there are a few layers to calculating this properly. An incorrect result can influence you to make bad advertising decisions. The main things to look at for calculating CPR include:
Step 1: Choose a time frame
The first thing to do is to decide which advertising period you want to look at. It can be however long you like. Typically, selecting a time frame between a week and a month is good practice to avoid any fluctuations in between campaigns.
Step 2: Find your total cost
Next, you should note down the total cost of the selected ad or collection of ads. Now there’s a few ways to go about this. You can choose the total cost of ads over the calculation period or select a particular ad campaign.
Selecting individual campaigns can help you root out poorly performing ads and increase budgets for high outcome ones.
The cost you get after the assessment will be the numerator of your CPR formula.
Step 3: Define your desired outcome
The most important thing about CPR is to know what outcome each ad was for. Depending on your outcome your CPR value will change entirely. Typical types of ad outcomes can be:
- Leads - Emails and sign-ups
- Purchases
- Website traffic
- Video views
- Page likes and follows
The idea is to take a measure of the desired outcome from the selected ads over the selected period. This will be the denominator of your CPR formula.
Step 4: Calculate your CPR
Finally, divide the total cost of selected ad campaigns by the number of times you got your desired outcome. This will give you your Cost Per Result.
Examples of Calculating CPR
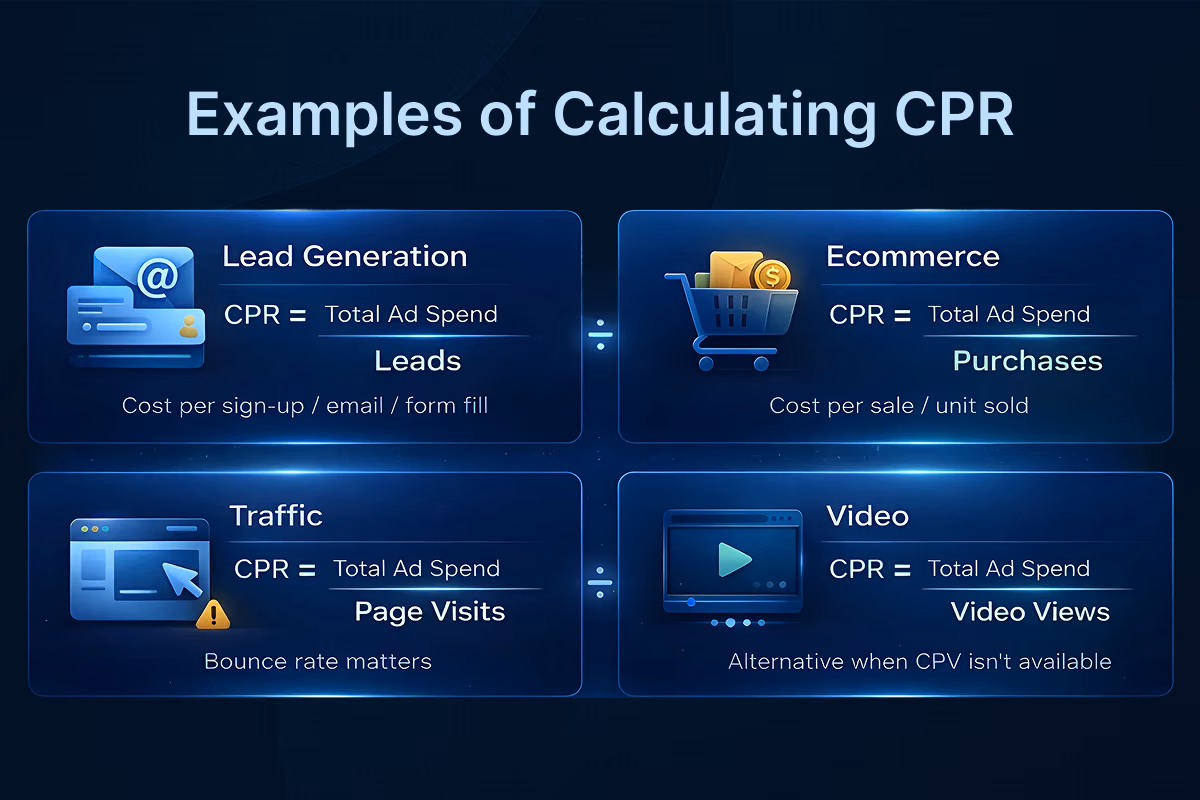
Examples help bring the cost per result concept to life. The formula stays the same, but the meaning of the result changes depending on the objective.
Example one: Lead Generation
An advertiser running a lead campaign uses cost per result to measure how much it costs to acquire each new lead. Leads can typically be a subscription, sign-up, form fill-up or email address. You should divide the total amount you spend with the number of sign-ups or subscriptions.
Example two: Ecommerce Purchase Campaign
This is the most typical for ecommerce businesses. CPR helps you set the price of your products by giving you an accurate estimate of how much it takes to sell each unit. Simply identify your ad costs over the desired period and divide by the total number of sales in that time.
Example three: Traffic Campaign
Website traffic is another popular goal for ad campaigns. Usually you’ll see website traffic come cheaper than leads and purchases.
You have to integrate Pixel or use other plug-ins to measure your website traffic from a particular ad link. Some ad managers directly provide this metric.
Next, you need to divide the cost with the total web page landings. An important thing to consider here is the bounce rate.
A lot of the time, people click on your ad but leave immediately without spending time on your website. This can give you a false result but no ultimate gains.
To avoid this, use Pixel integration and other plug-ins that track website visits for a set duration (few seconds or minutes).
Example four: Video Campaign
Video campaigns may be posted with just engagement as the objective. In this case, tracking the CPV can give you a good measure.
However, if your platform does not view the CPV, calculating the CPR by dividing the total cost with the number of views can come in handy.
How CPR Differs from Other Advertising Cost Metrics
Many marketers confuse cost per result with other popular cost metrics. Each metric plays a different role in performance analysis, and understanding the differences is essential.
Cost per click shows how much you pay for each click. Cost per thousand impressions shows how much you pay for exposure.
Cost per acquisition measures the cost of a completed conversion. Cost per engagement shows how much you pay for interactions such as likes, comments, or shares.
Cost per result stands apart because it is tied directly to your campaign objective.
It aligns performance with the specific goal you selected inside the platform and often provides the most meaningful insights for decision-making.
Factors That Influence Cost Per Result
Cost per result is influenced by a combination of creative, technical, and market factors. Advertisers must understand these variables so they can identify what is improving performance and what is hurting it.
Marking the change in each of these factors helps you get a proper read on your ad strategy. Calculating the CPR is not enough. You need to tie it down to the factors that affect it and tweak your strategy based on that.
How to Analyze CPR Effectively
Analyzing cost per result requires looking beyond a single number. Advertisers should monitor how cost per result changes over time to understand whether performance is improving.
They should compare cost per result across ad sets to identify which audiences and creatives are strongest.
- Track CPR trends over time: Look for patterns to understand whether your campaigns are becoming more or less efficient.
- Compare CPR across ad sets and audiences: This highlights which segments produce the best returns and which ones need improvement.
- Use CPR as a scaling benchmark: When CPR fits within your profit margins or acceptable lead cost, you can scale confidently.
- Pair CPR with other core metrics: Review CPR alongside return on ad spend, click through rate, and conversion rate for a complete performance picture.
- Avoid analyzing CPR in isolation: A campaign might have a higher cost per result but also bring in higher value customers or stronger downstream conversions.
Cost per result is also a key filtering metric when scaling budgets. If your cost per result aligns with your profit margins for ecommerce or your ideal lead cost for services, you can increase spending confidently.
Always interpret cost per result alongside return on ad spend, click through rate, and conversion rate. This creates a balanced understanding of performance and prevents misinterpretation.
How to Reduce Cost Per Result (Actionable Optimization Tips)
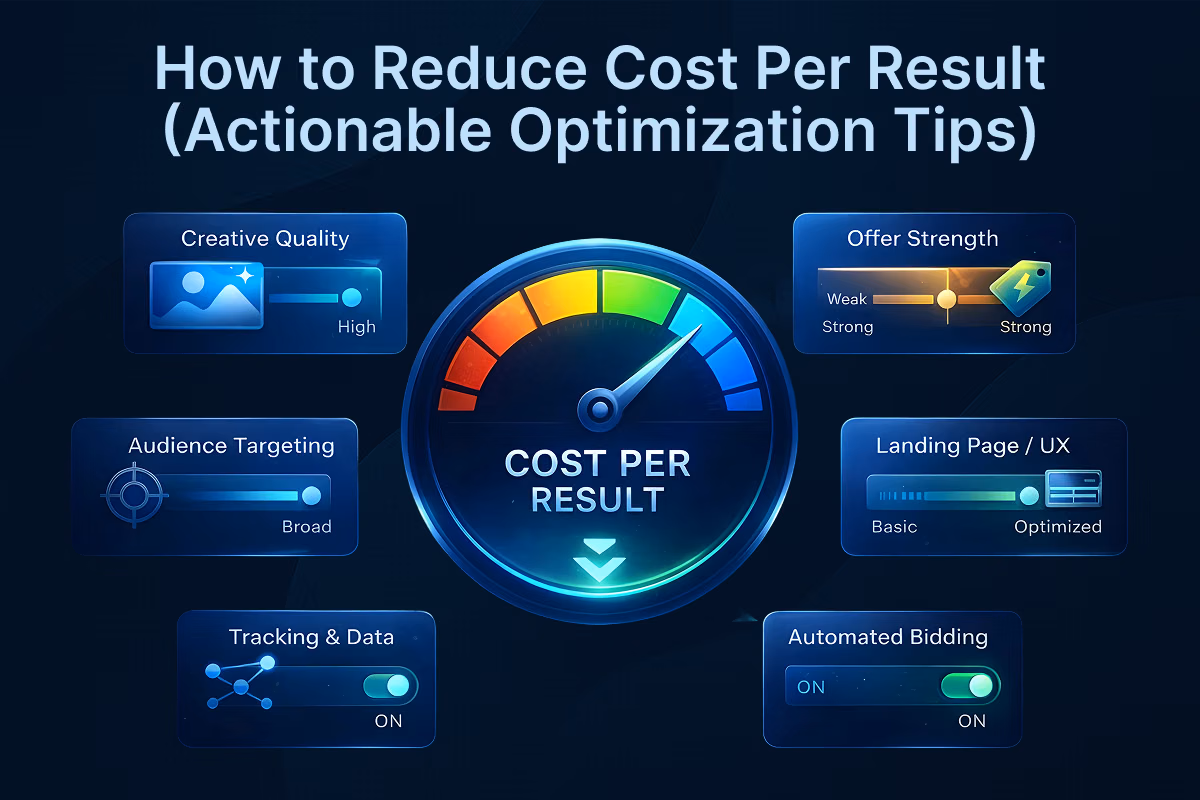
Lowering cost per result requires a combination of better creative, smarter targeting, stronger offers, and more efficient data. Below are practical strategies advertisers use to improve performance.
- Improve Your Creative: Strong visuals, clear messaging, and powerful hooks capture attention and improve engagement, which naturally lowers cost per result.
- Narrow or Refine Audience Targeting: High quality audiences convert at higher rates, reducing your cost per result. Using interest combinations, custom audiences, or lookalike variations often helps.
- Strengthen Your Offer: An attractive offer reduces friction, increases conversions, and makes the result easier and cheaper to achieve.
- Test Different Campaign Objectives: Choosing the wrong objective leads to poor traffic quality. Selecting an objective that matches your desired outcome improves efficiency.
- Optimize Landing Pages or Funnels: Clear design, fast load speed, and simple forms increase conversion rates and reduce cost per result.
- Use Retargeting: Warm audiences almost always produce lower cost per result because they already know your brand.
- Implement Conversion API or Proper Tracking: Accurate data helps algorithms optimize your campaigns more effectively.
- Leverage Automated Bidding When Appropriate: Automated bidding systems on Meta and Google often find cheaper conversions by learning from user behavior patterns.
Platform Specific CPR Considerations
Each advertising platform calculates and influences cost per result differently. Understanding these differences helps advertisers optimize more effectively.
Meta Ads
Meta uses cost per result for objectives such as leads, purchases, messages, add to carts, and landing page views.
Meta’s auction system rewards relevance and engagement, so high quality creative and strong user interaction can significantly lower cost per result.
Google Ads
Google’s cost per result depends heavily on keyword intent, Quality Score, bidding strategy, and conversion tracking accuracy.
High intent keywords and relevant landing pages usually produce the most efficient results.
TikTok Ads
TikTok relies far more on creative quality, cultural trends, and strong hooks.
The algorithm emphasizes content rather than keyword intent, which means the style of your video heavily influences cost per result.
When High CPR Is Actually Normal
Not every high cost per result is a sign of poor performance. Some industries naturally require higher spending because of competition, complexity, or lead value.
High ticket industries such as finance, legal services, real estate, and B2B often experience higher cost per result due to the value of each conversion.
Low intent campaigns, cold audiences, niche markets, and luxury product categories also tend to deliver higher costs.
Cost per result must always be judged against industry benchmarks, customer lifetime value, and profitability margins.
Common Mistakes When Calculating CPR
Many advertisers misinterpret cost per result due to avoidable mistakes.
Using the wrong result metric leads to inaccurate analysis. Forgetting to track secondary conversions can create misleading conclusions. Mixing data between different objectives often makes cost per result impossible to interpret.
Some common mistakes include:
- Not considering Returns on Ad Spend (ROAS): CPR without having an accurate idea of the outcome of the results can lead to bad advertising decisions.
- Using the wrong objectives: If your ad isn’t intended for an objective, it will perform poorly in delivering that, inflating your CPR.
- Not tracking secondary conversions: Conversions can come from interactions after the initial click on the ad. Tracking this is harder and requires expert guidance, which you can get from services like Uproas.
- Evaluating CPR too early: You need to choose the write time to assess the performance of an ad. Usually, long-term ads lead to results slowly but also cost lower per outcome.
These errors can be avoided through clear goal setting and proper tracking.
Maximize Your CPR with Uproas
Cost per result is one of the most important metrics for evaluating advertising performance. By understanding the formula and the factors that influence it, marketers can uncover whether their campaigns are efficient, profitable, and scalable.
When tied to clear goals and accurate tracking, cost per result becomes a straightforward yet powerful tool. Using agency ad accounts from Uproas can help you with maximizing your CPR. Agency ad accounts are aged, high-value, and proven to provide low CTR.
We offer:
Uproas also offers informative blogs on measuring CPR and other important metrics to improve your ad strategy. Analyzing metrics offers clarity in a marketing world full of complex data.
Frequently Asked Questions
What does “cost per result” actually measure?
Cost per result tells you how much you spend to get one desired action from your ads. That action depends on your goals like a lead, purchase, view, or click. It shows how efficiently your campaign is delivering the result you care about.
How is CPR different from CPC or CPM?
CPC shows the cost of a single click. CPM shows the cost of 1,000 impressions. CPR goes deeper by telling you how much it costs to get your real goal. It connects your spend directly to outcomes, not just traffic or visibility.
What is a “good” CPR?
A good CPR depends on your industry, audience, and objective. For example, a $5 CPR might be great for leads but too high for basic traffic campaigns. The best way to judge CPR is to compare it with your profit margins, lead value, or previous campaigns.
How often should I check my CPR?
Checking CPR every few days works well for most campaigns. Avoid checking too early, especially in the learning phase, because the numbers will be unstable. A week-long window usually gives more reliable data.
Can high CPR still be acceptable?
Yes. Some industries naturally have high costs because the leads or purchases are worth more. High-ticket services (legal, finance, real estate, B2B) often show expensive CPRs but deliver high lifetime value, which justifies the spend.

Mark Voronov

Latest blogs

TikTok Ads Statistics 2026: Benchmarks, Rates and Performance Data
With 8.7M businesses competing, discover key TikTok ads statistics and different benchmarks to beat the competition and refine your ad performance.

Static vs Dynamic Ads: Key Differences, Examples & How to Choose in 2026
Compare static and dynamic ads, their key differences, examples, and when to use each format to improve targeting, conversions, and ROI in 2026.

Geographic Segmentation: Definition, Variables, Examples & How Marketers Use It
Stop wasting ad spend on guesswork. Geographic segmentation uses location data to reach the right audience at the right place and drive real ROI.

How to Manage Multiple Facebook Accounts on One Device
Learn how to manage multiple Facebook accounts on one device safely using browser isolation, account separation, AdsPower, and Uproas tools.

Bing vs Google Ads: Which Advertising Platform Is Better in 2026?
Confused between Bing vs Google ads? Learn the key differences, including cost, reach, and performance. Pick the right ad platform for your business.

7 Best Klaviyo Agencies for Ecommerce Brands in 2026
Looking for a reliable Klaviyo email marketing agency for your ecom business? Here is our list of 7 best Klaviyo agencies for e-commerce you should consider.
.avif)
ROAS Benchmarks: Industry, Platform & Profitability Data (2026 Guide)
Master ROAS benchmarks with this 2026 guide. Get industry, platform (Google, Meta, TikTok, Amazon), and profitability data, plus how to set your own targets.

Facebook Users Statistics (2026): Global Numbers, Demographics, Growth & Trends
Find out the most intriguing Facebook users statistics in 2026 including MAUs, DAUs, demographics and key insights related to engagement and ads.

Best Sites to Buy Old Facebook Accounts in 2026
Looking to buy an old Facebook account? Here is the list of the 7 best providers of high-quality, aged Facebook accounts you should consider.