
90+ Google Ads Statistics: Revenue, PPC Benchmarks, and Advertising Insights

Google has the largest digital advertising network in the world. Aside from being the number one search engine with 16.4 billion searches daily, it has an advertisement display network of more than 2 million websites and apps. With all of this advertising potential, Google has become highly competitive among digital marketers around the world.
But before you plan your Google ads strategy, it would be very helpful to take a look at some key stats and benchmarks. This blog presents more than 90 Google Ads statistics and PPC benchmarks, along with key takeaways you can use to design the perfect ad campaign.
Key Takeaways
Going through such an enormous amount of ad statistics and data can be very tiring. To save you the effort of analyzing countless figures, this overview highlights the most crucial Google advertising statistics you need to understand before developing your marketing strategy.
- Google Ads reach over 90% of total internet users globally
- Google Search ads contribute the most to global ad spend at $198.08 billion, followed by YouTube ads and Display network ads
- More than 2 million websites, apps and publishers are in the Google Display Network
- Average CTR for search ads is 3.17%, for display ads is 0.46% and for shopping ads is 0.86%
- Average CPM for YouTube ads is $3.53
- >80% of Google search campaigns managed via Smart Bidding or automated rules
- Asia Pacific has the fastest growing adoption rate for Google Ads
- 40-50% average bounce rate for paid traffic from Google Ads
Global Overview of Google Ads
Let's start with some global overviews of Google ads.
1. 39% of global digital ad spend attributed to Google
Google gets nearly 40 cents of every dollar spent on digital advertising (39%). This is a massive share of the digital advertising revenue, way ahead of Facebook's 18 cents and Amazon's 7 cents per dollar. This makes Google one of the most attractive platforms online to target for ad campaigns. (Source: Cropink)
2. More than 7,000,000 advertisers use Google Ads worldwide
Google is widely popular as an advertising platform across several countries in the world. With millions of users making Google searches everyday, it seems like a no-brainer that advertisers would flock to Google Ads and center their marketing strategies around it. (Source: Digital Third Coast)
3. Over 100 Billion Ad Impressions Served Daily Across Google Platforms
Google is estimated to deliver more than 100 billion ad impressions every day across Search, Display, and YouTube. With billions of daily searches, millions of partner websites, and over 2 billion YouTube users, Google’s ad network reaches nearly every corner of the digital world, making it the largest ad delivery system on the planet.
4. Google Ads has an 80.20% market share in the pay-per-click (PPC) market
Pay-per-click ads are ones that appear on webpages and queries made by everyday internet users, which once clicked, will charge the advertiser at a certain rate determined by the publisher. These ads are the heart and soul of nearly all ads on Google. Competing with other platforms in the same landscape, Google has the largest market share by a landslide when it comes to PPC advertising. (Source: Demandsage)
5. $264.59 billion spent on Google ads globally in a year (2024)
Google Ads holds the third highest amount of ad spend at 15.5% in 2024 among all online advertising platforms in 2024. They are closely followed by Facebook and Instagram by Meta which gain 36% and 27% of total global ad spend per year. (Source: Statista)
6. Over 80% of businesses worldwide use Google Ads as their main paid media channel
Google searches are used by more than 90% of internet users in the world, making it an immensely popular choice as an advertising platform for business. Businesses of all sizes and industries flock to google, with small and medium businesses having the highest percentage of ad spend compared to company revenue. (Source: Demandsage)
7. 11.24% year-over-year growth of Google’s total ad volume
This large growth of ad volume closely compares to the global average YoY growth of ad volume on all social media platforms at around 11.6%. Google is one of the largest growing ad companies in the world, with more diverse mechanisms of ad delivery than Meta platforms and TikTok. (Source: Statista)
8. Google Ads reach 90% of total internet users worldwide
The Google Display Network places ads on over 2 million websites and reaches 90% of internet users worldwide. This volume also reflects the sheer number of searches that reaches a staggering 16.4 billion per day. Millions of customers make Google a highly lucrative advertising platform for businesses of all industries. (Source: Google)
Google Advertising Revenue Breakdown
Google Ads is one of the biggest sources of Google's revenue. Here are some stats.
9. A total of $348.16 billion in revenue for Google’s parent company Alphabet
Google is owned by parent company Alphabet, which also owns YouTube and other Google products. The total revenue comes from ad spend from advertisers and includes non-ad products that Google has to offer. (Source: Statista)
10. 74.71% of Google’s total revenue came from Google ads
A staggering 264.19 billion dollars came from ad revenue for Google in 2024, which is the majority of the total revenue reported by Alphabet in the same year. The rest of the revenue is attributed to non-ad products by Google and other financial activities that the company undertakes to increase revenue. (Source: Statista)
11. Revenue gained from non-ad products at 24.0%
Non-ad products from Google include YouTube, Drive and Mail subscriptions, along with the newly included AI subscriptions that Alphabet offers. This also includes several other smaller products that Alphabet invests in which are not directly related to ads. The rest of the revenue comes from financial activities unrelated to ads that passively increase the company’s revenue. (Source: Statista)
12. Breakdown of ad revenue by product (Search, YouTube, Display)
Google Ads can be delivered in multiple ad formats, which contribute to a certain portion of its total ad revenue. However, Google search ads significantly dominate the other formats in terms of total ad spend. This is due to the sheer volume of search queries that take place each day, along with the comparatively cheaper costs and satisfactory conversion rate.
13. Mobile vs. Desktop Share of Google Ad Revenue
Most Google ad clicks now come from mobile devices, around 60–62%, while desktop accounts for the rest. Mobile drives the bulk of engagement, but desktop still contributes significantly since ads there often cost more per click.
14. $37,700+ average revenue per advertiser (ARPA)
Average revenue per advertiser is found by dividing up the total ad revenue from Google with the total number of advertiser accounts on Google Ads. (Source: Statista)
15. More than $3,000 average ad revenue generated per active Google advertiser monthly
Ad spend is limited on Google ad accounts based on the amount you have spent in the past. To access unlimited ad spending and limitless advertising, using Google agency ad accounts is the best strategy for any marketer entering this platform. (Source: Statista)
16. 74.71% of Alphabet’s income comes from advertising activities
The largest share of income that Google’s parent company Alphabet gains is from Google Ads. This clarifies its identity as an advertising company above all else. Only 24% of its income comes from subscriptions and other non-ad products by Google, with the remaining coming from financial activities unrelated to advertising. (Source: Statista)
17. 485 million paid clicks generated daily
The scale of paid clicks on Google’s advertising network is immense. One analysis estimated roughly 485 million paid clicks every day, based on about 8.5 billion daily searches and a 5.7% click‑on‐ads rate. (Source: My Digital Hero)
18. More than 2 trillion impressions monthly across the Google Display Network
When you look at the size of the Google Display Network (GDN), you’re dealing with staggering impression volumes. Breaking that monthly “2 trillion” figure into days suggests tens of billions of impressions per day across GDN.
19. More than 50% of revenue from automated bidding campaigns.
Additionally, Google itself states that more than 80% of Google advertisers are using automated bidding. While that 80% figure refers to advertisers (not revenue share), the implication is clear: automated bidding is now the dominant engine behind the majority of campaigns and thus the revenue expansion. (Source: Google)
20. Average ROI reported by businesses using Google Ads is 200%
Advertisers are expected to gain double the amount they invest in Google Ads by exploiting the high conversion rates offered by each of the ad types. This is highly preferable from traditional marketing options which display a global average of 140% ROI.
21. Estimated 2$ return per $1 spent on Google Ads
An estimated $2.14 return is expected for each dollar spent on online ads around the world. With Google’s average of 2$ per dollar, it presents itself in a competitive position among other online platforms that perform advertising for marketers. (Source: Demandsage)
22. More than 60% advertisers using Performance Max and AI-driven campaigns
Smart/automated tools are used by over 80% of advertisers. AI‑driven/Performance Max campaigns are very high, likely above the 60‑70% range — especially among more advanced advertisers.
Google Search Engine Advertising: Search Reach and Market Power
Let's take a look at some search engine stats!
23. Google represents 79.1% of the global online search engine market
Google represents 79.1% of the global online search engine market. Almost eight out of every ten searches happen on Google, making it the dominant platform for online discovery. (Source: Statista)
24. 16.4 billion Google searches daily on average
On average, there are about 16.4 billion Google searches daily. This massive search volume offers countless opportunities for businesses to reach potential customers at the exact moment they are looking for information, products, or services. The top organic result alone receives an average click-through rate of 27.6%, meaning ranking first organically can generate substantial traffic from billions of queries. (Source: Exploding Topics)
25. 63% of users click on paid ads in search results
Studies show that 63% of users click on paid ads in search results. Paid ads are especially effective for commercial intent queries where users are looking to buy or take action. Mobile devices account for about 68% of these clicks, highlighting the importance of mobile-optimized campaigns, landing pages, and ad creatives. (Source: Demandsage)
26. 94% of clicks go to organic vs. paid results.
When looking at the overall click distribution, organic listings dominate. Around 94% of clicks go to organic results, with only 6% going to paid ads. Moreover, the top organic result receives roughly 19 times more clicks than the top paid result. This demonstrates that while paid ads can be effective, organic rankings remain critical for driving high volumes of traffic.
27. Google shows on average 7 ads per search query
This crowded landscape makes competition for clicks intense, so advertisers must focus on ad relevance, quality, and compelling calls to action to stand out. Across industries, the average click-through rate for search ads is around 3.17%, showing that even visible ads must be well-optimized to earn clicks. (Source: Digital Third Coast)
28. Google received 95% of its paid clicks through mobile phones
With mobile now the primary channel for ad interactions, it is essential for advertisers to ensure their campaigns and landing pages are fully optimized for smartphones and tablets. Display ads generally have lower engagement, with CTRs around 0.5%, while search ads typically see higher interaction rates, reinforcing search as the most effective channel for paid campaigns. (Source: Exploding Topics)
29. Total Google search revenue amounts to $198.08 billion
Advertising accounts for more than 77% of Google’s total revenue, emphasizing how critical search ads are to the company’s business model. The majority of ad spend, about 74.97%, is allocated specifically to Search campaigns. (Source: Statista)
30. 74.97% of Google ad spend allocated specifically to Search campaigns
For PPC benchmarks, the average global cost per click for Google Search Ads is about $2.69. The click-through rate is reported at roughly 91%, and the average conversion rate is 4.40%, although industry-specific rates can vary, with some campaigns achieving up to 7.52%. (Source: Statista)
PPC Statistics for Search Ads
PPC Ads remains very popular on Google till date. Here are most important PPC stats.
31. Average global CPC for Google Search Ads is $2.69
This gives advertisers a ball‑park figure for what a “typical” click might cost globally. Although your actual CPC will depend heavily on industry, geography and competition. (Source: WebFX)
32. Average CTR for Search Ads is 3.17%
This is much higher compared to other formats, with Display ads having a CTR of 0.46% and Shopping ads with 0.86% only. The CTR for search ads is more than 3 times higher than all 2 other formats, proving its effectiveness and popularity as an ad format in Google Ads. (Source: Demandsage)
33. Search ads on Google see an average conversion rate of 4.40%
A conversion indicates that not only has the user clicked on your ad but has accomplished the task the ad was meant to be for. The conversion rate ties to sales, leads or website visits, depending on the goals you set for your ads campaign. This means that, on average, about 4 to 5 clicks out of every 100 convert, based on whatever “conversion” you’re measuring. (Source: WordStream).
34. $48.96 average CPA (Cost per Acquisition) for Search campaigns
Industry benchmark data indicates that across industries, the average CPA for search campaigns is about $48.96. (Source: Word Stream)
35. Average Quality Score distribution is 6.2.
An average quality score distribution of 6.2 is seen across ads published as Search campaigns on Google. A good quality score to aim for is somewhere between 7-10.
36. 50-75% average impression share for top keywords
Impression share (IS) on Google Ads indicates how often your ads showed out of the total eligible impressions. Many advertisers strive for an IS of 80%+ on very important keywords, depending on budget, bids and quality.
37. 20-40% of advertisers using exact vs. broad match keywords
Many agencies report a shift toward broad match plus automation, but without a consistent global statistic.
Google Display Network (GDN) Statistics
Google Display Network (GDN) is relatively new. Here are GDN stats.
38. More than 2 million websites, apps and publishers in Google’s Display Network
The Google Display Network (GDN) is enormously large. This gives display ads on Google enormous reach and cheap CPMs. Display campaigns can reach more users on average than search simply by principle as they appear across all of the websites under the Google Display Network. (Source: Google)
39. Display ads on Google reach 90% of users worldwide
The enormous reach is attributed to the vast network of websites and publishers existing in Google’s Display Network. (Source: Google)
40. Average CPM for Display Ads is $1 or less
This means that display inventory, by impression cost, tends to be far cheaper than search clicks. CPCs from Display ads come at around $0.63, which is also significantly lower than a dollar.
41. 0.46% average CTR for Display Ads
Display ads are relatively cheap and do not have a high CTR compared to other formats. However, advertisers typically make up for the low CTR with a higher volume of display ads as they come cheap. (Source: Word Stream)
42. Average Conversion Rate for Display Ads is 0.77%
According to some benchmark tables, display campaigns convert at a lower rate than search. Because display usually targets earlier‑in‑funnel audiences or uses broader targeting, the lower CVR is expected. This is accompanied by a much higher CPA of $75.51. (Source: Word Stream)
43. Percentage of advertisers using responsive display ads is now over 75%
This rapid adoption is fueled by automation and personalized dynamic ad creation, helping marketers reach audiences across devices more effectively with improved engagement rates. (Source: CMG Local Solutions)
44. Average frequency (impressions per user) per campaign is typically 3 to 4
This range balances brand visibility and user experience, preventing ad fatigue while ensuring sufficient impressions for message retention.
45. Display ads are approximately 60%-70% cheaper than search ads on Google
Search ads command higher CPCs averaging $5.26 due to user intent for conversions, whereas display ads primarily build awareness and therefore cost significantly less per click. This cost difference guides budget allocation strategies. (Source: Valasys Media)
YouTube and Video Advertising Insights
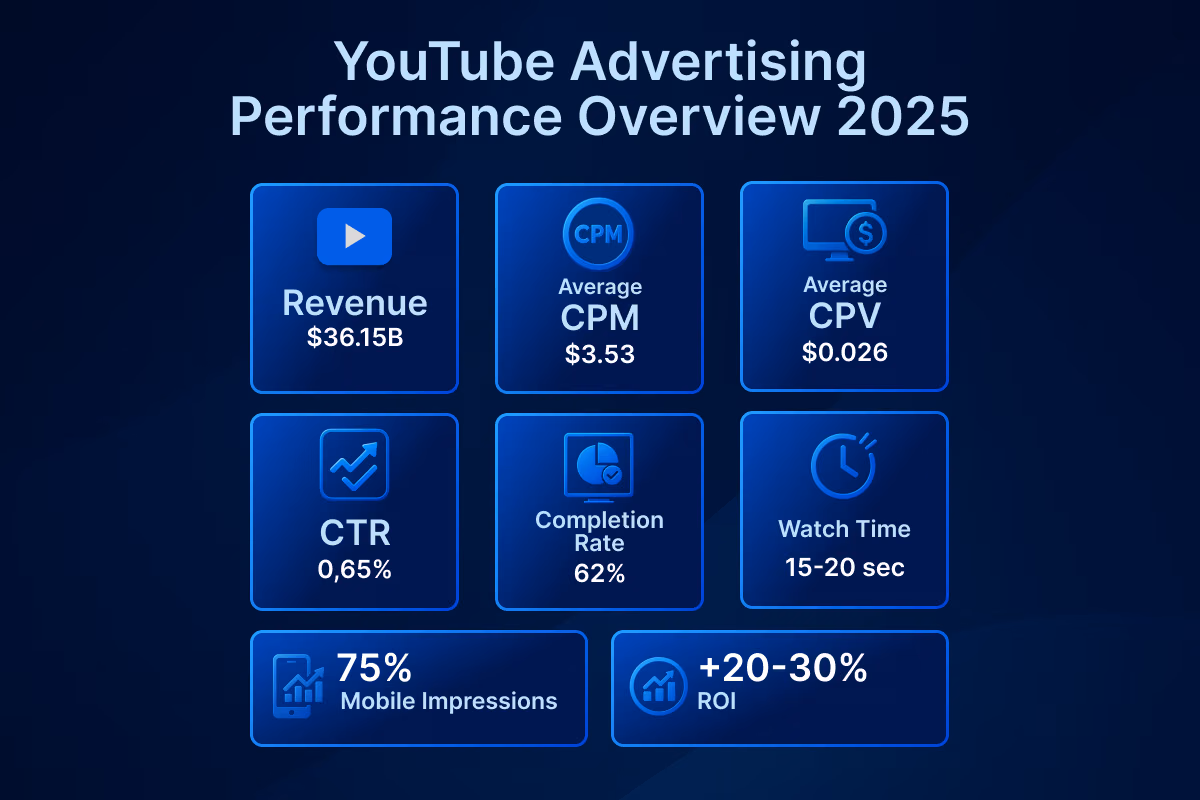
46. 13.68% of Google’s total ad revenue generated from YouTube
YouTube is the second largest contributor to Google’s ad revenue, coming in just below search ads. This amounts to $36.15 billion in ad revenue attributed to YouTube. (Source: Statista)
47. Average CPM for YouTube video ads is $3.53
The average cost per million impressions is more than 3 times as high as for display ads. This is expected, however, due to the video format of YouTube ads which deliver higher value per impression compared to static banner ads in the Google Display Network. (Source: Store Growers)
48. Average CPV (Cost per View) is $0.026
The incredibly low cost per view attributes to how skipping ads and not watching for a certain amount of time will not count as a view. The average YouTube Ads view rate is 31.9%, which explains how a lot of YouTube ads are inevitably skipped before the threshold time.
49. Average CTR for YouTube Ads is 0.65%
The CTR for YouTube Ads is lower than search ads but close to that of display ads. This also relates to the goals of the YouTube ads, which are primarily for impressions and exposure rather than engagement and sales. (Source: Store Growers)
50. Average completion rate for TrueView ads is around 62%
Shorter ads under 15 seconds see even higher completion rates, highlighting the need for concise, engaging messaging to capture audiences quickly on YouTube. This metric is key for advertisers optimizing video ad effectiveness.
51. Average watch time per YouTube ad impression ranges from 15 to 20 seconds
This depends on ad length and format, with users typically spending 40–50 minutes per session on YouTube, making ad engagement a critical opportunity for brands. (Source: Marketing LTB)
52. Over 2.5 billion businesses globally use YouTube ads monthly in 2025
This makes YouTube one of the largest digital ad platforms by advertiser base, reflecting its strong reach and influence in digital marketing landscapes. (Source: NetZoll)
53. About 75% of YouTube ad impressions are served on mobile devices
Mobile dominance in video consumption drives this proportion, urging advertisers to optimize creatives specifically for mobile viewing experiences. (Source: YouTube)
54. ROI from YouTube advertising is 20-30% higher than traditional TV advertising in many sectors
YouTube’s targeting precision and engagement measurement capabilities deliver better returns on investment compared to traditional TV, though TV retains brand-building strengths in premium contexts.
Google Shopping and eCommerce Campaigns
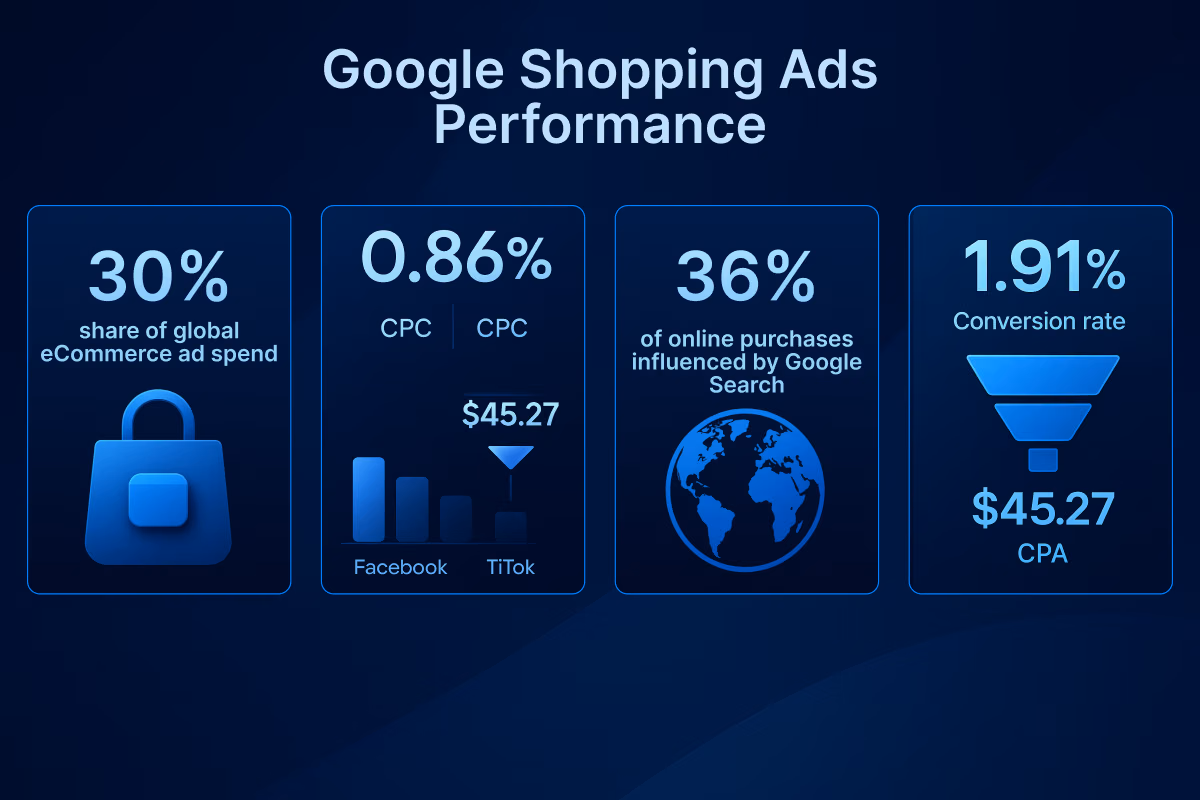
55. Google Shopping captures about 30% of global eCommerce ad spend
This significant share underscores Google Shopping’s pivotal role in driving product discovery and conversions in retail advertising. (Source: CMG Logical Solutions)
56. Average CTR for Shopping Ads is 0.86%
This is significantly lower compared to search ads, although the placement for shopping ads shares similar spaces with search ads. It is, however, nearly double that of display ads. (Source: Word Stream)
57. Average CPC for Shopping Ads is $0.66
Google Shopping Ads offer a highly cost-effective average CPC of $0.66, which is significantly lower than major social media platforms. Facebook Ads average $0.97-$1.00, Instagram Ads are $1.01-$1.20, and TikTok Ads can exceed $1.00.
58. 1.91% average conversion rate for Shopping Ads
Conversion rate is the key performance indicator to notice for shopping ads, as sales are the primary conversion to target. However, conversion rates are lower than search ads. This may be attributed to the fact that conversion goals for search ads are easier to achieve than for shopping ads which involve direct sales. (Source: Word Stream)
59. Average CPA of $45.27 for eCommerce advertisers
This is a similar amount to the CPA for search ads on Google, but significantly lower than that for display ads. The similarity in CPA relates to the sharing of placements for shopping and search ads. (Source: Store Growers)
60. Percentage of online purchases influenced by Google Search or Shopping Ads is approximately 36%
Google Search and Shopping Ads significantly impact product discovery and buying decisions, with around one-third of all product searches starting on Google and influencing shoppers' choices.
Automation, AI, and Insight Ads
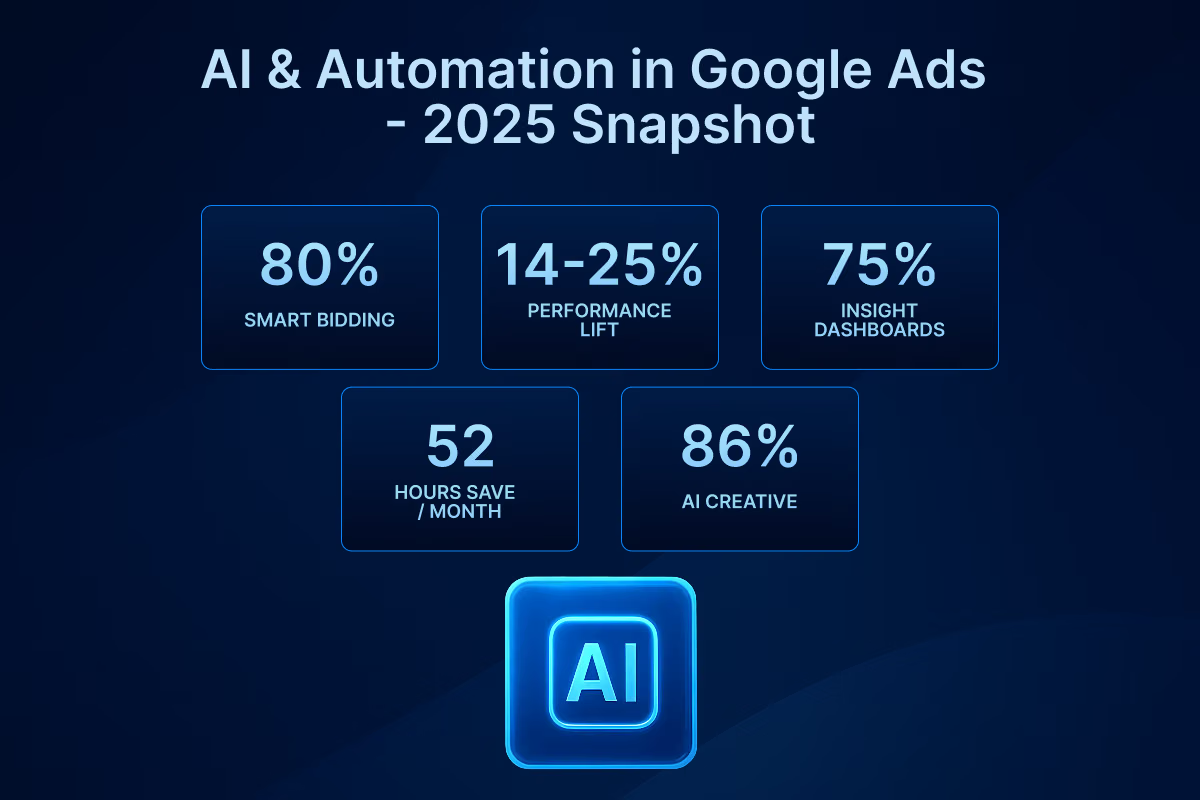
61. >80% of Google Ads campaigns managed via Smart Bidding or automated rules
About >80% of Google advertisers use automated/Smart Bidding strategies (Google’s own materials report “more than 80%”). (Source: Google )
62. Average performance improvement from automation (CPA / ROAS lift)
Google reports that advertisers switching bid strategies (e.g., Target CPA → Target ROAS) can see roughly ~14% more conversion value on average; other industry case-studies show CPA/efficiency gains in the 15–25% range depending on vertical and implementation. (Source: Google)
63. More than 75% of advertisers using insight-ads dashboards or data-visualization tools
75–88% of organizations use analytics/measurement or visualization tools in their marketing stack. This is a good proxy for adoption of “insight dashboards” among advertisers. (Source: Salesforce)
64. Average of 52 hours saved per month via automation
Surveys of marketers using AI/automation report large time savings. One study found users saved about 13 hours per week on average with AI/automation. (Source: NY Post)
65. 78% of total ad impressions optimized through machine learning
Programmatic/auction-time optimization and AI-driven bidding are now dominant; industry forecasts say autonomous AI will manage the majority of programmatic spend. (Source: eMarketer)
66. 86% of campaigns using AI-generated creative assets or dynamic search ads
Generative AI adoption for creative is exploding, surveys (IAB) show ~86% of advertisers are already using or planning to use GenAI for video ad creation, with projections of high adoption across other ad creative formats. (Source: IAB Digital)
Publisher and Partner Network (AdSense & AdMob)
Publisher and partner network is an important aspect of Google ads. Let's take a look at some of these stats.
67. Total revenue distributed to Google AdSense publishers ($ billions)
Multiple industry summaries estimate Google distributes roughly $~10 billion per year to AdSense publishers. Google’s payout rules and revised revenue-share language are public . Treat the $10B figure as a commonly-cited industry estimate. (Source: WebFX)
68. 50-60 million active AdSense publishers globally
Industry summaries report tens of millions of sites using AdSense, commonly-cited estimates are ~50–60 million sites using AdSense worldwide. (Source: WebFX)
69. Average RPM (Revenue per 1,000 impressions) for AdSense publishers between $3-$20
AdSense RPM varies widely by niche, geography, and format. Public publisher surveys and guides show large ranges: generic sites often $0.25–$3 RPM, while higher-value publishers/niches may see $5–$20+ RPM. (Source: Mile Tech)
70. 62% of mobile traffic in AdSense revenue
Mobile dominates web and app usage; industry sources show mobile accounts for a majority of traffic and a large share of ad impressions. Google’s ad network gets a large slice of mobile ad spending. Use these public data points to infer that mobile represents the majority of AdSense/AdMob impressions/revenue (percent varies by publisher and app). (Source: Business of Apps)
71. 80% average publisher payout rate on Google AdSense
Google’s AdSense revenue-share rules: publishers generally receive ~80% of the publisher-available revenue in many buy/sell setups; when advertisers buy via Google Ads for AdSense inventory publishers may effectively receive around ~68% of the advertiser spend after platform fees in some scenarios. (Source: Google)
72. 1M+ active apps monetized through AdMob
Google’s AdMob public page cites “1M+ apps use AdMob” (AdMob by the numbers). (Source: (Source: AdMob)
Regional Distribution and Market Demographics
North America, Europe, and Asia Pacific are the major markets for Google Ads.
73. Regional ad revenue share (North America, Europe, Asia-Pacific, Latin America)
Market research breakdowns commonly show the US having the highest regional ad revenue share, followed by Europe, Middle East and Africa. APAC sits at third at the table, but has a higher growth rate of ad volume than all of the other regions of Google Ads revenue. (Source: Fortune Business Insights)
74. Asia-Pacific is the fastest-growing region by Google Ads adoption rate
APAC (Asia-Pacific) is widely reported as the fastest-growing region for digital ad adoption and spend growth — China, India, and Southeast Asia show higher growth rates vs. mature North American/European markets. This is the same for other social media platforms like Facebook as well, with India being the largest market for online advertising with over 200 million users. (Source: eMarketer)
75. Average CPC variance by region
CPCs vary dramatically by geography. High-income markets (US, UK, Australia) typically have much higher CPCs vs. emerging markets (often multiple times higher). Industry tables show country CPC differences of many tens to hundreds of percent (e.g., U.S. CPCs frequently several times higher than low-cost geos). (Source: Word Stream)
76. Top five countries by ad revenue contribution
Top ad spend countries commonly reported: United States, China, United Kingdom, Japan, Germany — these are regularly the top five contributors in global ad-spend rankings. (Source: Oberlo)
77. Top five industries by total ad spend
Retail/eCommerce, Finance (banking/insurance/fintech), Telecom/Tech, Automotive, and Media/Entertainment (including streaming) are consistently among the largest industry categories for digital ad spend. (Source: eMarketer)
78. Average CTR difference between developed vs. emerging markets
CTR differs by region. Developed markets often show higher CPCs and in some categories higher CTRs, but differences depend on vertical and ad format. (Source: Word Stream)
Industry-Specific PPC Benchmarks
While all industries can benefit from PPC, there are some industries that run PPC ads more often.
79. $1-$3 CPC for retail campaigns
Benchmarks vary by source and format (search vs display). Recent benchmark compilations show retail/search CPCs commonly in the $1–$3 range, with search CPC higher than display. (Source: StoreGowers)
80. $4-$15 CPC for SaaS campaigns
SaaS (B2B) CPCs are typically higher due to competition and high LTV — many benchmarks put SaaS/B2B CPCs in the $4–$15 range depending on targeting and keywords. (Source: Focus Digital)
81. 2.5-4% CTR for financial services
Financial services CTR benchmarks (search) commonly sit around 2.5–4% depending on the dataset; one recent median for finance was ~3.9% in a paid-benchmarks feed. (Source: Varos)
82. Average conversion rate for education campaigns is between 8-11%
Education landing pages/campaigns often convert well relative to other industries, Landing-page studies show education landing-page median CVRs as ~8–11% (depending on sub-sector). (Source: UnBounce)
83. Average CPA for healthcare between $30 - $100
Healthcare CPAs vary widely by country and service; recent industry tables place healthcare CPAs higher than average in many markets. (Source: Focus Digital)
84. Average ROAS across all industries
Google’s public guidance and surveys frequently cite an approximate 2:1 return for many advertisers (i.e., ~200% ROAS or $2 earned for every $1 spent) as a general baseline, individual ROAS varies widely by industry and campaign objective. (Source: Coupler)
Here are some industries with their average ROAS:
- Heavy equipment & industrial: ~6.9 × (690 %)
- Manufacturing: ~5.4 × (540 %)
- Home services (local): ~3.3 × (330 %)
- Retail & brick-and-mortar: ~2.1 × (210 %)
- SaaS (software as a service): ~1.7 × (170 %)
Trends, Forecasts, and Future Outlook
It is expected that Google Ads will keep growing in popularity in following years to come. Here are some future forecasts.
85. Projected growth rate of Google advertising revenue 7-10%
Analyst forecasts for Google/Alphabet ad revenue growth in 2025 are in the ~7–10% range depending on quarter and source. This complements the YoY growth of ad volume on Google which stands a little above 11% for the year 2024. (Source: eMarketer)
86. 8-12% expected rise in PPC cost-per-click year-over-year
Industry reports show CPCs rising year-over-year across many industries; recent analyses cite ~8–12% YoY increases in average CPC for many advertisers. (Source: PPC Hero)
87. Forecasted share of video and display formats in total ad impressions
Video is the fastest-growing digital ad format; forecasts and industry reports predict video (including CTV & YouTube) will take a growing share of total impressions. Many forecasts show display+video together remaining a large share. Video’s share is projected to increase materially over the next 2–3 years. (Source: eMarketer)
88. Increase in mobile ad spend predicted more than 70% of total Google Ads budget
Mobile continues to take a growing share of budgets; forecasts show mobile’s share of ad spending climbing year-over-year. (Source: Business of Apps)
89. Predicted adoption of AI-driven keywordless targeting almost 78%
Programmatic and AI-first targeting are rapidly expanding: analyst forecasts predict the majority of programmatic spend will be managed by autonomous AI within a few years. That implies strong adoption of AI-driven/keyword-agnostic approaches. (Source: eMarketer)
90. Forecasted Google Ads market share vs. Meta and Amazon
Market-share forecasts show Google continuing to lead global digital ad revenues. Google/YouTube share is often reported at ~24–40% of global digital ad revenues depending on scope, with Meta (Facebook/IG) and Amazon trailing. For US search specifically Google keeps a dominant share, reporting >70%+ of US search ad spend. (Source: eMarketer)
Performance Metrics and Conversion Analytics
Last but not the least, performance metrics is a vital stat to consider.
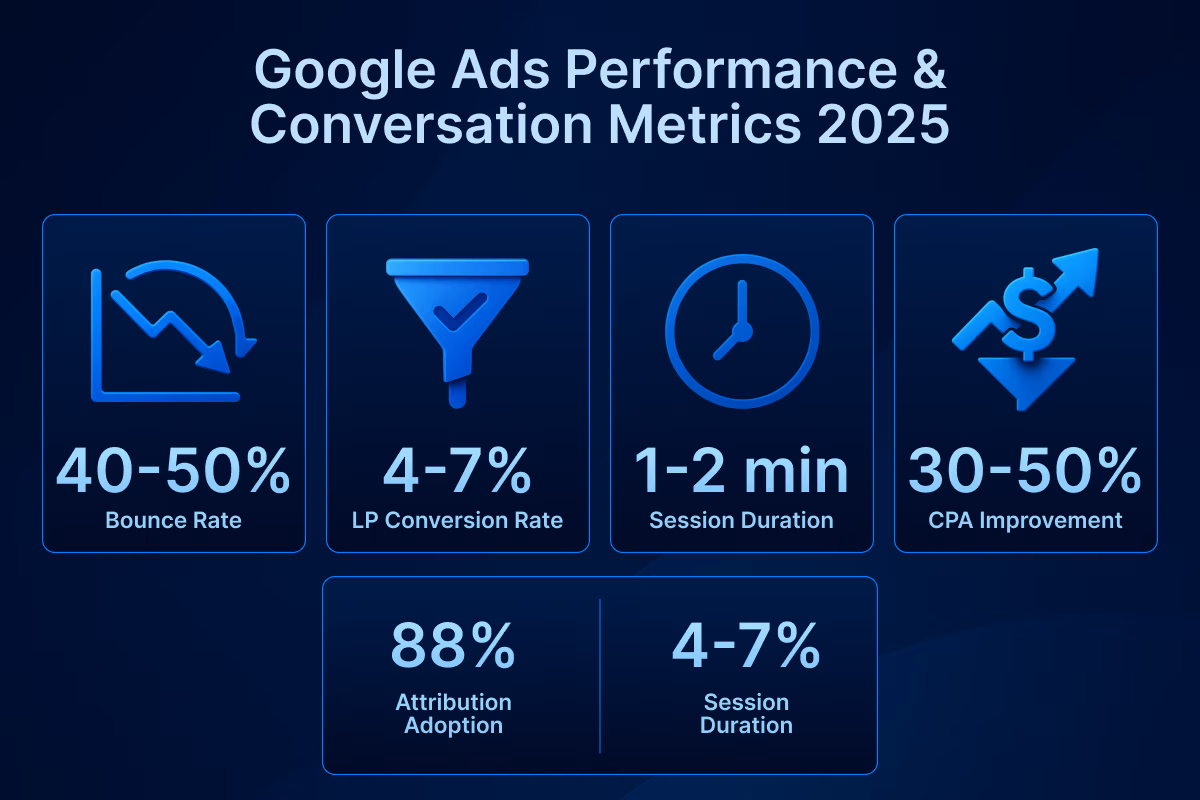
91. 40-50% average bounce rate of paid traffic from Google Ads
Channel-bounce benchmarks show paid search/paid traffic bounce rates around ~40–50%. Paid search tends to have lower bounce than display. CXL and channel-benchmark compilations cite paid search bounce ≈ ~44% in several datasets. But ranges vary by vertical and landing page type. (Source: CXL)
92. Average landing page conversion rate between 4-7%
Landing-page median conversion rates vary; many datasets put a baseline median around 4–7% across industries, while top-performing education/verticals can show 8–11%. Industry benchmark reports give medians such as ~6.6% for landing pages overall. (Source: Unbounce)
93. Average session duration for paid traffic between 1-2 minutes
Session duration varies by campaign intent and content; paid search sessions are typically shorter than organic content sessions. Common industry benchmarks place paid session durations in the 1–2 minute range depending on the campaign and landing page.
94. 30-50% CPA reduction for remarketing vs. cold traffic
Multiple industry studies report remarketing/retargeting can deliver ~30–50% lower CPA compared with cold acquisition. Many sources give ~50% lower CPA as a common benchmark in aggregate. (Source: Cropink)
95. Average ad frequency before conversion between 2-6
Average frequency before conversion depends on vertical and funnel stage. Many advertisers target 2–6 impressions before conversion for prospecting retargeting flows. Higher-consideration purchases will need more exposures.
96. 88% of advertisers using attribution-modeling tools on Google
Surveys show analytics/adoption is high. ~88% of marketers report using analytics/measurement tools, and many of those use some form of attribution modeling or multi-touch analytics. Exact share using full attribution modeling varies by company size and sophistication. (Source: Sales Force)
Stay Ahead in Your Google Ads Game with Uproas
Making full use of these 90+ statistics can be a challenging task, especially if you’re starting fresh. The good news is, Uproas can give you a head start.
Google has restricted more than 39.2 million ad accounts in 2024, which is nearly a 200% increase from the previous year. This is accompanied by spending limits and scaling restrictions which are often imposed even on regular advertisers. Agency ad accounts from Uproas are the one-stop solution for all of these annoying hindrances.
With Uproas, you can get:
- Unlimited ad spend potential
- Faster ad approval times
- Uninterrupted ad campaigns
- Fewer bans and restrictions
- 24/7 customer support
All of these perks help you scale your ads smoothly and without limits. Move past any advertising obstacles and make the most out of your ad campaigns with Uproas.


Latest blogs
Bing Ads Cost in 2026: Everything You Need to Know
Stop wasting money on ad spend. See the 2026 Bing Ads cost benchmarks, real industry CPAs, and hidden ROI data you need to outperform competitors.

6 Best AI UGC Video Creators for TikTok Ads in 2026
Avoid expensive creators. Find the 6 best AI UGC video platforms for TikTok ads in 2026. Cut production costs, test faster, and scale your ROI.
TikTok Ads Statistics 2026: Benchmarks, Rates and Performance Data
With 8.7M businesses competing, discover key TikTok ads statistics and different benchmarks to beat the competition and refine your ad performance.

Static vs Dynamic Ads: Key Differences, Examples & How to Choose in 2026
Compare static and dynamic ads, their key differences, examples, and when to use each format to improve targeting, conversions, and ROI in 2026.
Geographic Segmentation: Definition, Variables, Examples & How Marketers Use It
Stop wasting ad spend on guesswork. Geographic segmentation uses location data to reach the right audience at the right place and drive real ROI.

How to Manage Multiple Facebook Accounts on One Device
Learn how to manage multiple Facebook accounts on one device safely using browser isolation, account separation, AdsPower, and Uproas tools.

Bing vs Google Ads: Which Advertising Platform Is Better in 2026?
Confused between Bing vs Google ads? Learn the key differences, including cost, reach, and performance. Pick the right ad platform for your business.

7 Best Klaviyo Agencies for Ecommerce Brands in 2026
Looking for a reliable Klaviyo email marketing agency for your ecom business? Here is our list of 7 best Klaviyo agencies for e-commerce you should consider.
.avif)
ROAS Benchmarks: Industry, Platform & Profitability Data (2026 Guide)
Master ROAS benchmarks with this 2026 guide. Get industry, platform (Google, Meta, TikTok, Amazon), and profitability data, plus how to set your own targets.