Google Ads Benchmarks (2026): CPC, CTR, CPA & Conversion Standards by Industry

Say you’ve successfully managed to track your CPC, CTR, CPA and other Google Ads metrics. But if you take a look at them now, they seem nothing more than random numbers.
The only way to make sense of the myriad of metrics you’ve just collected is to compare them with the most recent Google Ads benchmarks.
Benchmarks and advertising standards provide a reference you can compare to before you take decisions based on your ad performance.
Unfortunately, Google doesn’t show you if your CPC is too high or your CTR is too low. The only way to know how poorly or effectively your ads are performing is to compare them with other ads in your industry as per Google ads benchmarks.
Comparing the stats you get from your dashboard with real-time benchmarks from your industry can give you a sense of how much you should be spending. This blog offers a deep dive into the most relevant industry respective Google Ads benchmarks for 2026.
What Benchmarks Represent (Core Metrics Defined)
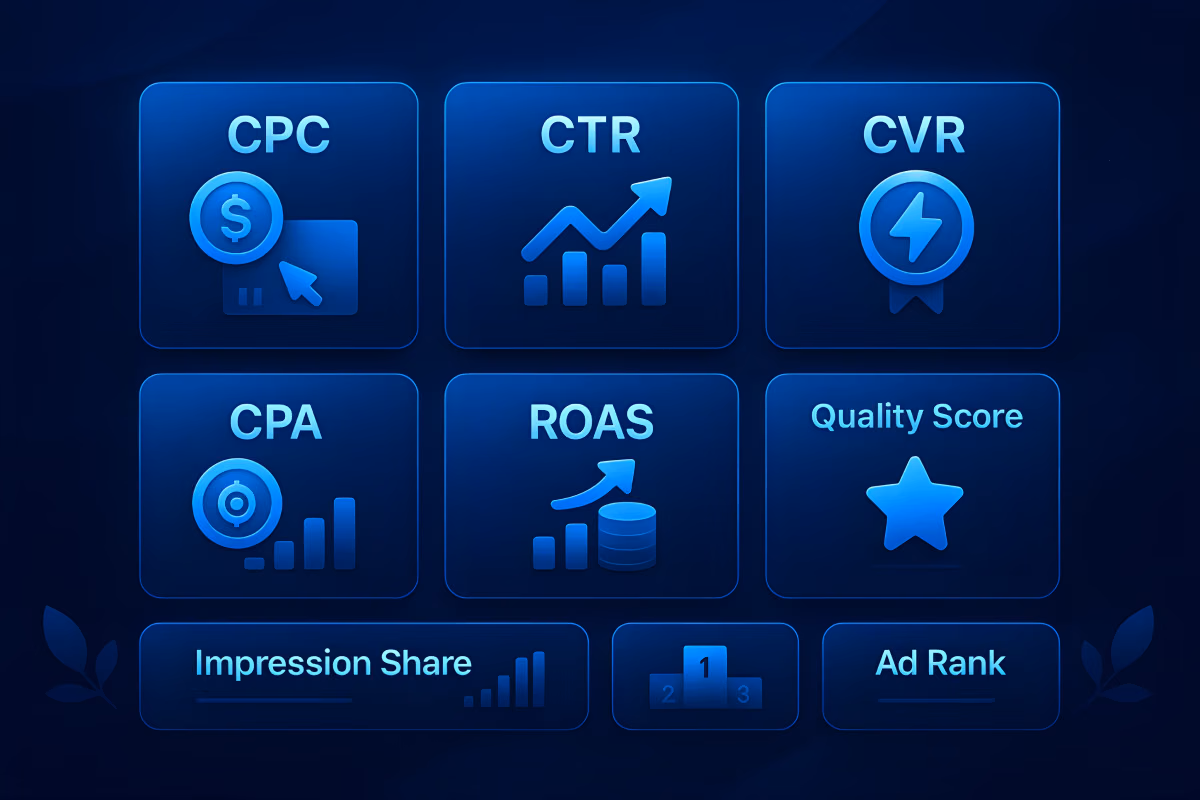
There are quite a few core metrics you need to keep track of if you’re running Google Ads. It’s very easy to get lost in a sea of numbers. Some of the metrics in Google Ads to keep an eye out for are:
Cost Per Click (CPC)
CPC is the average amount you pay for each click by your audience. It’s a direct measure of competition and bidding efficiency. The higher the CPC, the more money you have to pay for the same number of interactions. So, lower CPC is always better.
Click-Through Rate (CTR)
CTR is the percentage of your audience clicking on your ads after viewing them. A higher CTR is always good and means your ads are performing more effectively and attracting more clicks.
Conversion Rate (CVR)
CVR is the percentage of your audience who end up following through on your campaign objectives. Conversions depend on your campaign objectives and can be calculated using the CVR formula.
Higher conversion rates are typically achieved by improving your landing webpage and having a better and more interactive funnel.
Cost Per Acquisition (CPA)
This is the amount you are paying for a single conversion on average. It combines your ad cost with how well you convert traffic. In a sense, it is almost similar to the CVR and is interchangeable in some cases.
Return on Ad Spend (ROAS)
ROAS is the total amount of money you make divided by the amount you spend on ads to make that money. This is a direct measure of your profits.
It’s one of the most important metrics to consider before you make an ad budget or fix pricing for your products.
Quality Score
Google's internal score that estimates how relevant and high-quality your ads and landing pages are. A higher Quality Score can lower CPC and improve ad rank. Getting a high quality score is a long term and difficult process.
However, you can take a shortcut by getting a high quality score agency ad account from services like Uproas.
Impression Share & Ad Rank
Impression share is how often your ads appear in eligible auctions, while Ad Rank determines your actual position. These metrics help you understand not just cost but visibility.
Global Google Ads Performance Snapshot

Google Ads performance looks different depending on campaign type, device, and region.
Getting an idea about relevant Google Ads statistics can help you visualize what the market is like and how to work with it. Here are some of the highlighted statistics you should take a look at:
- Search campaigns usually deliver the strongest conversion rates, because users are actively searching with intent. In 2025, search campaigns on Google Ads saw an average 4.4% conversion rate.
- Display campaigns, on the other hand, have much lower CTRs. The Google Display Network consists of more than 2 million websites where you can publish ads. Despite this, the average CTR reported is 0.46%.
- Mobile vs. desktop: Many advertisers report higher CTR on mobile but slightly weaker conversion rates. This aligns with the broader trend where mobile brings volume, but desktop often delivers more committed users.
- Cost trends: CPC has risen for 87% of industries over the past year, reflecting rising competition and changing auction dynamics.
- High-value verticals: Industries with high customer lifetime value, like legal, finance, and B2B, tend to be the most expensive in terms of CPC but often also the most profitable if conversions happen at a solid rate.
CPC Benchmarks (Cost Per Click)
CPC is one of the most commonly used Google Ads metrics because it shows how much budget you're spending for user engagement.
Patterns & Trends
- Keywords with strong commercial intent (for example, “hire a lawyer” or “insurance quote”) tend to drive up CPC because many advertisers are bidding on them.
- High-lifetime-value industries such as legal and finance pay a premium for clicks.
- Seasonal spikes, like holiday periods, can push up CPC because demand increases.
- Automated bidding (like Target CPA or Max Conversions) adds complexity: it can bid aggressively in competitive auctions, making CPC more volatile.
Real World CPC by Industry
CTR (Click-Through Rate) Benchmarks
CTR reflects how compelling your ads truly are. To make your campaigns more potent, your audience must feel an intentional pull to click.
A higher CTR is always advantageous because it strengthens your overall return from Google Ads. Achieving it depends on the craftsmanship of your creative and your ability to stay aligned with evolving trends and user expectations.
What Influences CTR
- Ad relevance: A close match between the keyword and your ad headline helps.
- Ad copy quality: Clarity, attractive call-to-action, and benefits in your ad text make a big difference.
- Ad format: Responsive Search Ads often outperform because Google dynamically tests different headlines and descriptions.
- SERP competition: When rivals load up on extensions, sitelinks, and rich results, your ad may be less prominent, which affects CTR.
Industry Level CTR Data
Conversion Rate (CVR) Benchmarks
Conversion rate is determined by applying the standard conversion formula, but its real value comes after you decide which actions truly count as conversions for your campaigns.
Once those goals are defined, calculating your conversion rate allows you to measure performance in a clear, quantifiable way. Conversion rate, however, varies heavily depending on ad goals and industry.
Getting a high conversion rate in general depends on the content on your ad and the landing page it leads to. Good funnelling techniques go a long way to ensure a higher CVR.
What Drives Conversion Rates
- Landing page alignment: Your landing page must deliver what your ad promises.
- Speed and usability: Page load time and mobile experience matter a lot.
- Offer strength: A compelling offer or clear value proposition helps persuade users.
- Audience signals: Remarketing or targeting high-intent audiences often boosts conversion rates.
Industry CVR Benchmarks
CPA (Cost Per Acquisition) Benchmarks
CPA is one of the most practical metrics for performance marketers because it links your spending directly to the conversions you generate, making it an immediate gauge of true efficiency.
If your CPA is too high, acquiring new customers or leads may not be sustainable. But if it's too low, maybe you're not bidding smart or your conversions are low-value.
Understanding benchmark CPA helps you judge whether your campaigns are efficient or out of line.
What Affects CPA
- Conversion rate: Higher conversion rates tend to drive CPA down.
- Audience quality: More qualified or warm audiences often convert at a lower cost.
- Bidding strategy & attribution: Smart bidding and correct attribution can significantly reduce CPA.
- Competition & seasonality: Auction dynamics change, driving CPA up or down.
- Automation: Autobidding strategies (like target CPA) can push CPA up during early learning or down as the algorithm optimizes.
Real-World CPA by Industry
Here are benchmark CPAs based on recent data (2025):
These CPAs vary because different industries have very different conversion values and customer acquisition costs.
ROAS (Return on Ad Spend) Benchmarks
ROAS is one of the most important metrics in the decision making process of any ad campaign. It depends directly on how much money your ads are making you.
This can be hard to calculate, as the return on ads isn’t always directly quantifiable. However, marking trends in profit increase and sales volumes can be a good place to start.
ROAS depends heavily on the industry and the type of products you want to advertise.
What Shapes ROAS
- Profit margins: The biggest factor in ROAS is the profit margin you set for your products. Having a higher profit margin can ensure more return on each sale, but risk an increase in ad spend.
- Campaign type: Choosing the right campaign can make or break your ROAS.
- Audience management: Optimizing your ad audience to high value buyers and getting rid of viewers with low buying prospects can help your ROAS up quite a bit.
- Customer lifetime value (LTV): For subscription or SaaS businesses, even a low initial ROAS can be worth it if the LTV is high.
Industry Trends in ROAS
- E-commerce: Higher ROAS is visible for shopping ads.
- SaaS / Subscription: Typically, the short term ROAS is lower relative to other industries. However, the lifetime value of customers more than makes up for that deficit.
- Finance & Insurance: Narrow and accurate targeting is a must to get a higher ROAS in the finance industry.
- Local services / Education: One of the more predictable types of industry. ROAS is usually stable and predictable and does not fluctuate much with ad choices.
Quality Score and Ad Rank Benchmarks
Your ad rank and quality score are calculated by some standards Google sets for its advertisers. As the names suggest, quality scores are simply a way of evaluating how proper your ads are for the audience and how well they react to it.
Ad rank also depends on similar parameters like the quality score. The method of improving quality scores and ad ranks is to work on your ads and create more relevant content for your industry.
What Influences Quality Score
- Expected CTR: A prediction based on previous data in the industry of the CTR of your ads.
- Ad relevance: An important aspect to consider is to keep up with trends and relevant searches by users who will view your ads.
- Landing page experience: Having a good landing page is paramount to making your quality score improve and decrease bounce rate.
Benchmark Patterns
- Retail and Education: These industries have stable and predictable formats and landing pages. So, it is easier to get a higher quality score and the industry standards are quite high as well.
- B2B and Legal: These are some of the most competitive ad spaces and keywords used are common and broadly used. The median quality score is usually lower compared to other industries.
- SaaS and Tech: Typically a moderate standard of quality scores. They are not as stable and predictable as Education and not quite as competitive as B2B markets.
Search vs. Display Benchmark Differences
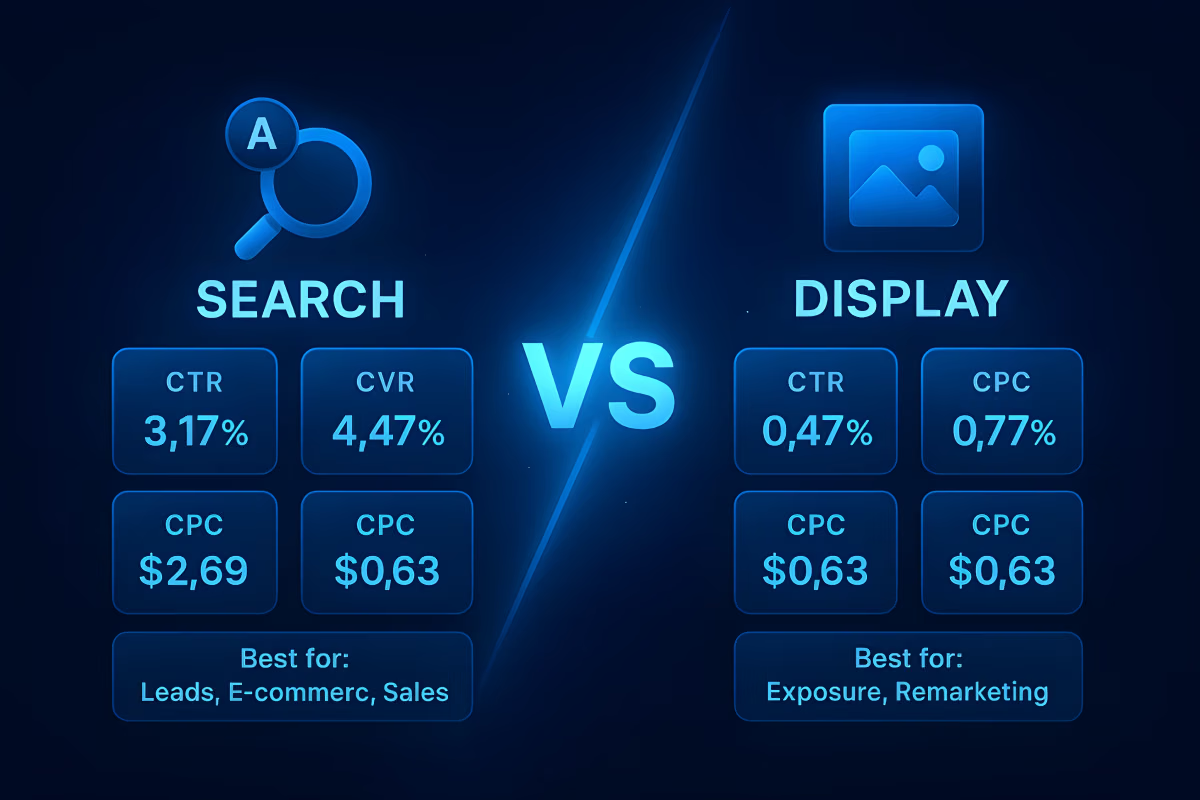
Search and Display ads are the biggest and most mainstream advertising modes in Google Ads. However, there are some key differences between the benchmarks in both types.
These represent the main differences between these two categories.
Desktop vs. Mobile Benchmark Differences
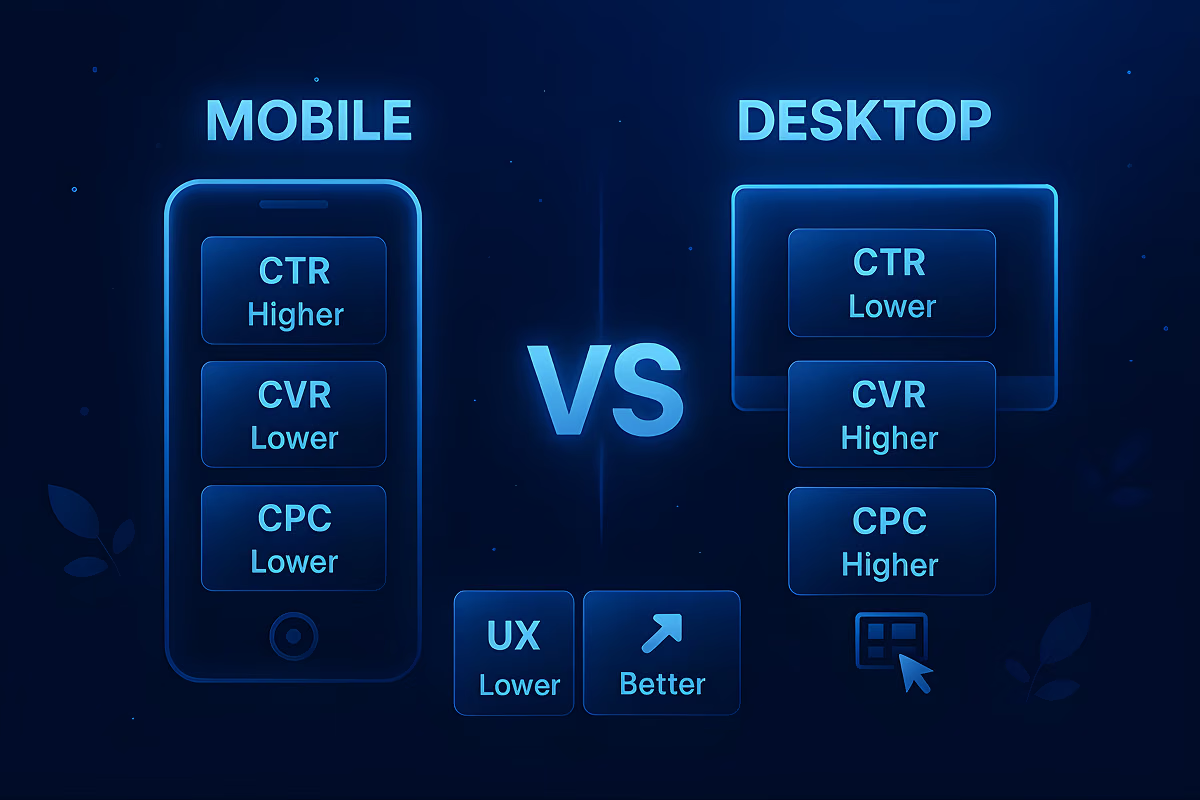
Let’s talk about the main difference between desktop and mobile benchmarks for Google ads. Device matters. Users get online on mobile devices more frequently than they do on desktop.
Alongside that, people also tend to use mobile and desktop for different tasks. Mobile internet use is usually based on day to day queries and communication.
On the other hand, desktops are used for tasks and research, or in a more formal setting. This also changes the viability of different industries while advertising on mobile or desktop.
Regional and Market Benchmark Differences
India is the largest market for Google Ads in the world while the Asia-Pacific is deemed as the fastest growing region. In contrast, North America, specifically the US, generates the highest value and return.
Regional markets create a significant impact in how the benchmarks are across all industries.
It is important to take note of these differences to get an innovative ad strategy for your specific business.
The North American and Western European ad markets have a much larger return and spending volume.
This is attributed to the high spending power of the audience in this region. You can expect to see higher CPCs and CPAs in this region as you compete with multiple high-value businesses during ad bidding.
Southeast Asia, LATAM, MENA and similar markets have lower CPCs.
But user behavior (device, ad engagement) is quite different. This directly translates to lower returns, meaning a lower CTR, CVR and CPA.
Industry Specific Benchmark Deep Dives
There is no point in knowing benchmarks if you’ll only compare them with the global average. To be a seasoned digital marketer, you need to meet the benchmarks of your specific industry.
This number may at times be much higher than global standards and at times quite low. Here’s an overview of how Google Ads benchmarks work across typical advertising industries on the internet.
The conclusions we can draw from this data are:
- Automotive: Audiences have high interest and ads are moderately costly.
- B2B: Some of the most expensive ads with the least amount of conversion.
- E-commerce and Retail: Clicks are cheaper and there is a healthy amount of audience interest.
- Education: There is good interest but costs are somewhere in the middle.
- Finance & Insurance: Expensive clicks and conversions with moderate or low interest in audiences.
- Healthcare: Stable industry with moderate benchmarks across the board.
- Legal: Very expensive ads with very few conversions.
- Real Estate: Costs are moderate but conversions are more expensive and less frequent.
- SaaS and Tech: High ad expenses and low conversions
- Travel & Hospitality: Clicks cost less to moderate with high interest among viewers.
- Home Services: Higher prices across the board but with high demand.
- Apparel & Fashion: Ads are inexpensive and with steady interest among customers.
- Beauty & Personal Care: Low to mid click costs with strong viewer attraction
2025–2026 Trends Shaping Google Ads Benchmarks
As 2026 approaches, several shifts are quietly transforming how Google Ads behaves. These changes influence bidding, creative quality, audience precision, and overall efficiency, making them essential for any benchmark comparison.
- Performance Max momentum: More brands are reallocating spend into Performance Max, blending search, display, video, and shopping into a single algorithm-driven system.
- AI-crafted creative: Machine-generated copy and assets are becoming routine, subtly affecting engagement and conversion quality.
- First-party data revival: Tighter privacy rules are pushing advertisers to rely more on their own customer data to fuel targeting and smart bidding.
- Heightened rivalry: More performance marketers are crowding the auctions, causing click costs to climb across many sectors.
- Video-first behavior: YouTube and Discovery formats now sit at the center of many strategies, reshaping typical engagement and conversion patterns.
- Finer audience slicing: Teams are segmenting users by value, behavior, and CRM signals to pursue higher-quality conversions.
How to Use Benchmarks Wisely
Benchmarks are helpful only when applied with intention.
- Compare within your field: Always measure yourself against your own industry, not generic averages.
- Spot friction points: Gaps between your numbers and the norm reveal where creative, funnel, or audience issues may sit.
- Set grounded targets: Use benchmarks to shape goals while keeping margins and lifetime value in mind.
- Monitor frequently: Revisit performance every quarter because auctions shift constantly.
- Scale with purpose: Expand spend only when your results outperform benchmarks and support your profitability.
Uproas Google Agency Ad Accounts: Get the Best Out of Your Google Ads
Getting an Uproas Google agency ad account can give you a big boost in improving your Google Ads strategy. These accounts are not your average sign-ups on Google.
We offer exclusive perks that can help you build and scale your ad campaigns to as big as you want. Some of the attractive benefits Uproas offers include:
- Limitless scaling and rapid approvals: Campaigns launch almost instantly, and spend can increase as fast as your strategy demands. No ceilings, no slowdowns.
- Consistently lower costs: Whitelisted accounts with strong history often achieve noticeably lower acquisition costs and more efficient bidding.
- Instant replacements for disabled accounts: If an issue occurs, a new account is provided immediately so performance never stalls.
- Stronger data stability: Your pixel and analytics data stay protected, ensuring continuity even when accounts change.
- Expert guidance behind the system: The platform is shaped by seasoned performance marketers who understand what true scale requires.
Conclusion
Benchmarking your Google Ads performance isn’t a pleasant extra; it is a vital compass. When you compare your click costs, engagement levels, conversion strength, and overall efficiency with authentic industry data, you gain a clearer sense of where your campaigns truly stand. The figures offer orientation.
Yet, the real magic appears when you connect them to your business objectives, experiment and refine relentlessly.
As Google Ads shifts toward AI-guided campaigns, Performance Max, and more intricate audience modeling, helps you remain competitive.
Getting an Uproas agency ad account can also help you get an edge and amplify your return on investment.


Latest blogs
ABM Stats: 2026 Benchmarks, ROI & Trends
From ROI to pipeline velocity, these 2026 ABM stats show exactly why account-based marketing dominates B2B growth.
.jpg)
The Real Price of Social Media Advertising: A Cost Guide for Advertisers
Find out what social media ads actually cost these days. Get to know about CPC, CPM, CPL, industry verticals, budget ranges, and ROAS across major platforms.
Bing Ads Cost in 2026: Everything You Need to Know
Stop wasting money on ad spend. See the 2026 Bing Ads cost benchmarks, real industry CPAs, and hidden ROI data you need to outperform competitors.

6 Best AI UGC Video Creators for TikTok Ads in 2026
Avoid expensive creators. Find the 6 best AI UGC video platforms for TikTok ads in 2026. Cut production costs, test faster, and scale your ROI.
TikTok Ads Statistics 2026: Benchmarks, Rates and Performance Data
With 8.7M businesses competing, discover key TikTok ads statistics and different benchmarks to beat the competition and refine your ad performance.
Static vs Dynamic Ads: Key Differences, Examples & How to Choose in 2026
Compare static and dynamic ads, their key differences, examples, and when to use each format to improve targeting, conversions, and ROI in 2026.

Geographic Segmentation: Definition, Variables, Examples & How Marketers Use It
Stop wasting ad spend on guesswork. Geographic segmentation uses location data to reach the right audience at the right place and drive real ROI.

How to Manage Multiple Facebook Accounts on One Device
Learn how to manage multiple Facebook accounts on one device safely using browser isolation, account separation, AdsPower, and Uproas tools.

Bing vs Google Ads: Which Advertising Platform Is Better in 2026?
Confused between Bing vs Google ads? Learn the key differences, including cost, reach, and performance. Pick the right ad platform for your business.