Facebook Ad Benchmarks: What’s a Good CTR, CPC, and Conversion Rate?

Facebook remains one of the most powerful platforms for reaching diverse audiences and driving meaningful business results. However, with increasing competition and evolving user behavior, simply running Facebook ads is no longer enough. Knowing how well or poorly your ads are performing is essential to make important business decisions. Advertisers must benchmark their campaigns against industry standards to understand what “good” performance looks like.
Facebook ad benchmarks, including metrics like the average CPC for Facebook ads, Facebook ads average click through rate (CTR), and conversion rate for Facebook ads serve as crucial yardsticks. These benchmarks provide actionable insights that help marketers evaluate whether their campaigns are on track, highlight areas that need improvement, and guide data-driven optimizations.
This comprehensive guide breaks down the latest Facebook advertising benchmarks, empowering you to measure your success accurately and craft campaigns that consistently outperform the competition.
What Are Facebook Ad Benchmarks and Why Do They Matter?
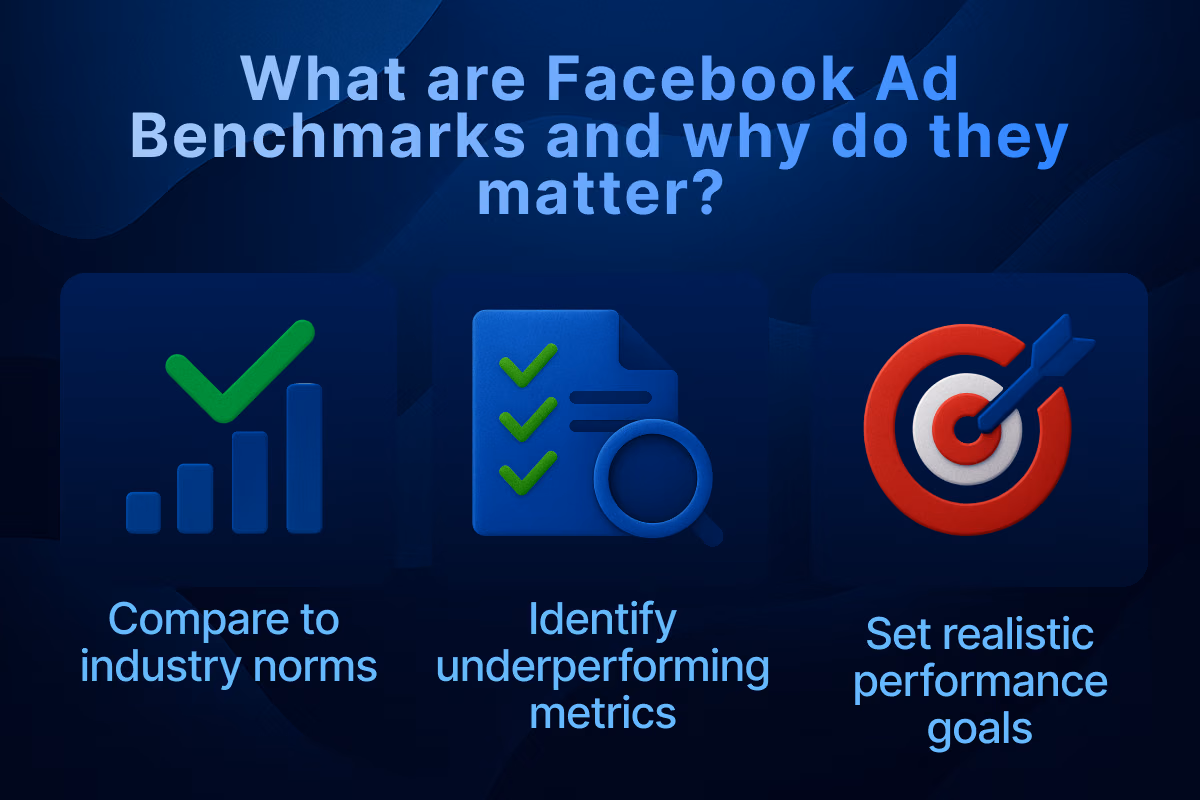
When running Facebook ads, it's easy to focus solely on your own numbers. But how do you know if those numbers are actually good? That’s where Facebook ad benchmarks come into play. These are industry-wide averages compiled from thousands of advertisers, campaigns, and dollars spent. They act as reference points for evaluating your ad performance, showing whether you’re outperforming the norm or falling behind.
Benchmarks help advertisers make sense of data by offering a standard to compare against. Without them, it’s difficult to tell whether a 1.2% click-through rate (CTR) is stellar or disappointing. For example, a 1.2% CTR might be above average for B2B, but low for eCommerce. Important business decisions, such as removing low performing ads or effectively scaling ad campaigns can be taken with a good grasp of Facebook ad benchmarks.
By understanding Facebook ad benchmarks, you can:
- Compare your results to industry norms: This helps you know whether you're competitive or need to make changes.
- Identify underperforming metrics: Spotting lagging metrics allows you to prioritize what needs fixing.
- Set realistic performance goals: Benchmarks keep your expectations grounded in real data rather than guesswork.
- Decide where to optimize first: If your CTR is above average but CPC is high, the problem isn’t engagement, it’s cost.
Benchmarks are not strict rules, but they provide crucial context that can lead to smarter advertising decisions.
How Often Should You Check Benchmarks?
Benchmarks change with seasons, trends, and platform updates. Checking your metrics weekly is ideal, but compare to benchmarks at least once per month. During competitive times like Black Friday or Q4, more frequent comparisons can help you stay agile.
Keep a spreadsheet or dashboard that logs:
- Monthly benchmark updates
- Your campaign averages
- Notes on optimization tests and outcomes
Average CPC for Facebook Ads
CPC, or Cost Per Click, is a foundational metric in Facebook advertising. It represents how much you pay each time someone clicks your ad. While it doesn’t guarantee a sale or conversion, CPC directly affects how far your budget can stretch. Lower CPC means more traffic for the same spend.
Factors That Affect CPC
Factors influencing CPC include audience targeting precision, competition in your niche, ad relevance score, and seasonality. Generally, a CPC above $2 without conversions signals a need to tweak your targeting or creative approach.
- Audience targeting (broad vs. niche): Niche audiences tend to have higher CPCs due to limited reach and competition.
- Competition in your niche: If many advertisers are bidding on similar demographics, your CPC will rise.
- Ad quality and relevance score: Meta rewards engaging and relevant ads with lower CPCs.
- Seasonality and demand: Q4 (holiday season) typically sees spikes in CPC due to higher competition.
Facebook Ads Average Click Through Rate (CTR)
CTR is one of the clearest indicators of how appealing your ad is to your target audience. It shows what percentage of people clicked your ad after seeing it. A low CTR usually means your ad isn’t resonating, while a high CTR means your creative and targeting are in sync.
Common Facebook ad mistakes such as landing page issues, poor creatives and bad placement can cause your CTR to sink. Determining the industry average for CTRs is crucial to understanding if your ads are performing optimally.
The current industry averages for Facebook ads CTRs are:
What Affects CTR
A CTR below 0.5% typically indicates poor targeting, weak creative, or message misalignment. Facebook ads with a CTR above 1.5% are considered strong performers across most sectors.
- Your ad headline and image/video: These are the first things people see. Use eye-catching and relevant creatives in your ad to increase CTR.
- Call-to-action (CTA): A weak or unclear CTA can reduce clicks dramatically. Always test multiple CTAs.
- Audience targeting and placement: If your ad is being shown to the wrong audience or on low-engagement placements, CTR will drop.
- Mobile optimization: Since most Facebook users are on mobile, your creative should load quickly and look great on small screens.
Conversion Rate for Facebook Ads
Conversion rate is arguably the most important metric. It tells you the percentage of users who take the desired action after clicking your ad. This could be a purchase, sign-up, download, or booking.
A high CTR with a poor conversion rate means your ad was interesting, but your landing page or offer didn’t deliver. Conversion rate reveals the percentage of users who take a desired action (purchase, signup, lead) after clicking an ad. Benchmarks currently are:
What Affects Conversion Rates
Conversion rates can vary wildly depending on the complexity of your funnel and the offer value. A simple lead magnet with one-click opt-in can get 10%, while a high-ticket SaaS demo might convert only 1% but still be profitable.
Low conversion despite good CTR often points to issues with landing pages, offers, or site speed rather than ad quality itself. If you’re getting clicks but no conversions, investigate your landing page and checkout process before changing the ad itself.
- Landing page speed and UX: A delay of just 1–2 seconds can significantly drop conversions.
- Offer strength and clarity: Your value proposition must be immediately clear and enticing.
- Form length or checkout friction: Shorter forms and frictionless checkouts almost always convert better.
- Consistency between ad and landing page: Messaging, visuals, and expectations must match to avoid drop-offs.
Meta Benchmarks and Industry Variations
While Meta rarely publishes public benchmarks, many third-party platforms analyze billions of dollars in ad spend to provide reliable estimates. These benchmarks vary widely across industries due to differences in buying behavior, competition, and audience intent. Aggregated data from platforms like WordStream, Revealbot, and AdEspresso validate these numbers.
Industry benchmarks vary significantly:
While keeping up with the industry standards may be a challenge, having a Facebook agency ad account can help you get a good start. Services like Uproas have 24/7 customer service that can help you manage your ad campaigns and take the right decisions. It also offers limitless scaling and unrestricted access to all of Meta’s ad services. You can also use Meta Business Suite Insights, Ads Manager reports, or third-party tools to track your specific Meta benchmarks for your niche.
How to Use Facebook Ad Benchmarks to Optimize Your Campaigns
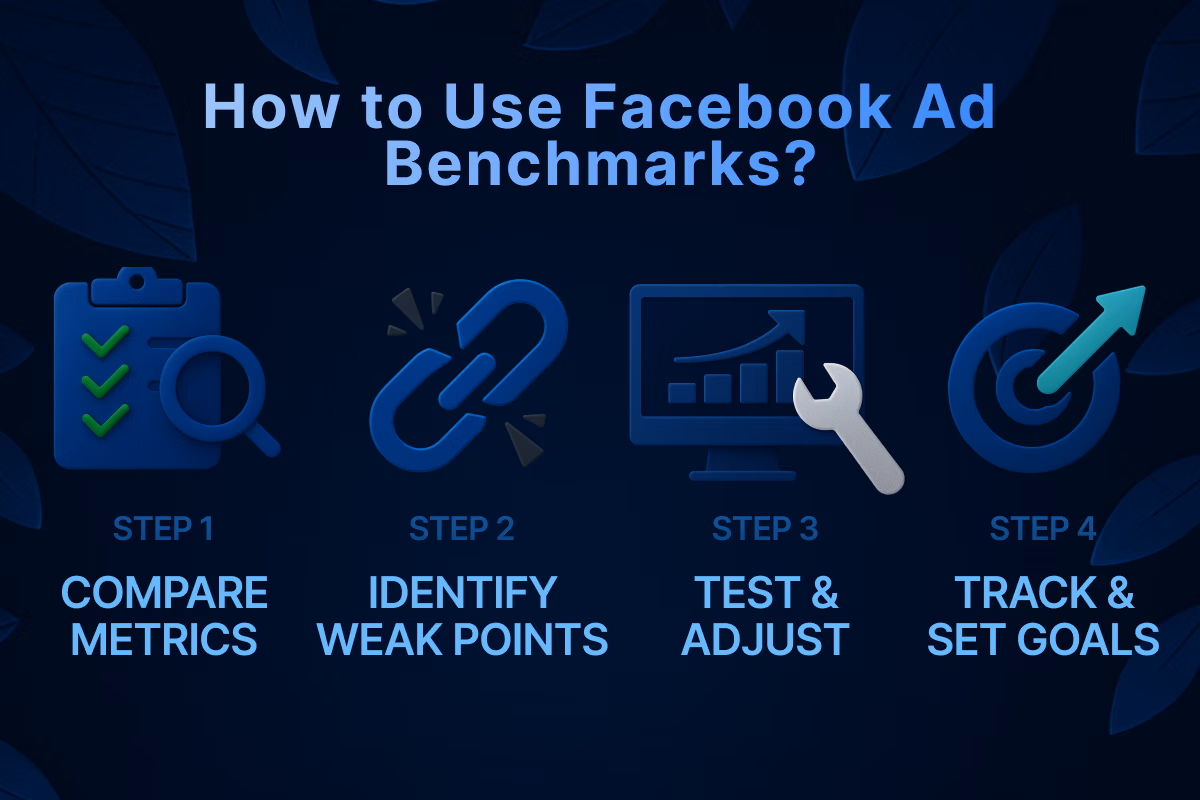
Knowing the benchmarks is only half the battle. The real value comes from using them to optimize and improve your campaign results. Benchmarks are only valuable when used as a tool for action. While it's helpful to know how your campaigns stack up against industry averages, the real power of benchmarks lies in how you analyze, interpret, and apply them to your Facebook ad strategy.
Below is a deeper, step-by-step guide on how to use Facebook ad benchmarks for continuous performance improvement.
Step 1: Compare Your Metrics to Benchmarks
Start by gathering your performance data directly from Meta Ads Manager. Focus on the core Facebook ad metrics most commonly used in benchmark analysis:
- CTR (Click-Through Rate): Tells you if people are engaging with your creative.
- CPC (Cost Per Click): Indicates how efficiently you’re driving traffic.
- CPM (Cost Per 1000 Impressions): Reflects how much visibility costs in your niche.
- Cost Per Result: Shows the cost of achieving your campaign objective (lead, purchase, etc.).
- Conversion Rate: Measures what percentage of clickers complete your desired action.
Create custom columns in Ads Manager to display these metrics side by side. Set filters by campaign objective or audience to get more granular insights. Then, compare your actual numbers to industry benchmark ranges. Are you above, below, or right in the middle? This gives you context and helps you avoid overreacting to fluctuations.
Step 2: Identify Bottlenecks and Weak Points
Once you’ve compared your performance to benchmarks, the next step is diagnosis. Look at the metrics in sequence, because poor performance in one area usually trickles down to others.
Here’s a breakdown of common scenarios and what they suggest:
Step 3: Test and Adjust
Optimization doesn’t stop at diagnosis. It requires active experimentation and continuous learning. Benchmarks tell you what “good” looks like. Testing tells you how to get there.
Here’s how to systematically optimize based on your benchmark comparisons:
Creative Testing:
- Launch new image/video ads every week or biweekly.
- Run A/B split tests with one variable at a time: headline, primary text, image, CTA.
Copy and CTA Variations:
- Try action-focused CTAs (“Shop Now” vs. “Learn More” vs. “Get the Offer”).
- Shorten or lengthen copy to match different user behavior patterns.
Audience Optimization:
- Create custom audiences based on website visitors, video watchers, and customer lists.
- Build lookalike audiences from your best customers: 1%, 5%, and even 10% to test.
Landing Page Refinement:
- Use heat maps and session recordings (like Hotjar or Microsoft Clarity) to understand behavior.
- Ensure fast page load speeds (under 3 seconds) on both desktop and mobile.
Budget Allocation:
- Shift budget toward high-performing ad sets that outperform benchmarks.
- Use CBO (Campaign Budget Optimization) to let Facebook allocate spend efficiently.
Step 4: Track Improvements Over Time
Benchmarks aren’t static. Set up a monthly performance review to track your KPIs against the latest available benchmarks.
- Create a monthly scorecard comparing current vs. previous month vs. benchmark.
- Tag which optimizations were made each month and correlate with metric changes.
- Establish “green, yellow, red” status indicators to quickly assess health at a glance.
Green = Above benchmark
Yellow = Near benchmark
Red = Significantly under benchmark
Step 5: Use Benchmarks to Set Internal Goals
Once you understand where your campaigns fall in relation to the average, you can create tiered performance goals:
- Baseline goal: Match your industry benchmark
- Growth goal: Beat the benchmark by 20%
- Stretch goal: Reach top 10% performance in your niche
This goal-setting structure helps your marketing team stay aligned, motivated, and realistic. It also gives leadership clear visibility into campaign success.
What’s a “Good” Facebook Ad Performance?
There’s no single definition of “good” performance. It depends on your business model, industry, sales cycle, and funnel structure. Still, beating the industry averages consistently means your campaigns are likely performing in the top 20–30%.
Use these reference points as soft goals:
- CPC below $1
- CTR above 1.5%
- Conversion rate above 3%
- Return on ad spend (ROAS) above 2x
Performing below these points signals potential areas for enhancement but do not panic as these numbers vary by sector and campaign goal.
Conclusion
Understanding and tracking Facebook ad benchmarks helps you scale smarter, spend better, and optimize faster. These benchmarks give you a compass, but it’s your job to navigate. Use them to diagnose issues, test intelligently, and move toward better ROI. A good idea to start is to get help from ad account services such as Uproas. These agency ad accounts will help you explore all of the above mentioned procedures without any limitations.
From CTR to CPC to conversion rate, your numbers tell a story. Benchmarks help you understand whether it’s a success story or a work in progress. Keep testing, keep iterating, and stay aligned with what your audience responds to.
Frequently Asked Questions
Q: What’s a good CTR for Facebook ads?
A: Above 1.5% is generally considered strong across industries.
Q: How much should I pay per click on Facebook?
A: Average CPC ranges from $0.70 to $1.20 depending on your niche.
Q: What if my conversion rate is low but CTR is high?
A: Likely, your landing page or offer needs optimization.
Q: Where can I find updated Meta benchmarks?
A: Check Meta Business Suite, Facebook Ads Manager insights, or tools such as Revealbot and WordStream.


Latest blogs
ABM Stats: 2026 Benchmarks, ROI & Trends
From ROI to pipeline velocity, these 2026 ABM stats show exactly why account-based marketing dominates B2B growth.
.jpg)
The Real Price of Social Media Advertising: A Cost Guide for Advertisers
Find out what social media ads actually cost these days. Get to know about CPC, CPM, CPL, industry verticals, budget ranges, and ROAS across major platforms.
Bing Ads Cost in 2026: Everything You Need to Know
Stop wasting money on ad spend. See the 2026 Bing Ads cost benchmarks, real industry CPAs, and hidden ROI data you need to outperform competitors.

6 Best AI UGC Video Creators for TikTok Ads in 2026
Avoid expensive creators. Find the 6 best AI UGC video platforms for TikTok ads in 2026. Cut production costs, test faster, and scale your ROI.
TikTok Ads Statistics 2026: Benchmarks, Rates and Performance Data
With 8.7M businesses competing, discover key TikTok ads statistics and different benchmarks to beat the competition and refine your ad performance.
Static vs Dynamic Ads: Key Differences, Examples & How to Choose in 2026
Compare static and dynamic ads, their key differences, examples, and when to use each format to improve targeting, conversions, and ROI in 2026.

Geographic Segmentation: Definition, Variables, Examples & How Marketers Use It
Stop wasting ad spend on guesswork. Geographic segmentation uses location data to reach the right audience at the right place and drive real ROI.

How to Manage Multiple Facebook Accounts on One Device
Learn how to manage multiple Facebook accounts on one device safely using browser isolation, account separation, AdsPower, and Uproas tools.

Bing vs Google Ads: Which Advertising Platform Is Better in 2026?
Confused between Bing vs Google ads? Learn the key differences, including cost, reach, and performance. Pick the right ad platform for your business.